Singapore Luxury Condo Market Trends: 4-Bedroom and Larger An eight-year trajectory of PSF, size, total price and volume (2019–2026)
- Rising PSF: Average transacted PSF for 4-bedroom-and-larger luxury condos climbed from $1,772 in 2019 to $2,206 in 2026, +24.5% over eight years.
- Shrinking units: Average unit size shrank from 2,386 sqft to 1,778 sqft, about −25% — large formats made "smaller and more compact."
- Total price fell: Size shrinkage outweighed the PSF gain, so average transacted price fell from $4.56M to $4.01M, about −12.1%.
- Demand surge: Annual volume rose from 596 units in 2019 to 2,209 in 2025, about 3.7×; ultra-luxury (5-bedroom and larger) grew from 41 to 291 units.
- Segment divergence: OCR family-sized luxury clears fastest (46 months, a slight premium); CCR trophy homes are hardest to resell (99 months, +10.4% premium, ~$8.25M average).
Price per Sqft vs Total Price
Over the past eight years, Singapore's luxury condo market has split in a counter-intuitive way: the price per square foot keeps rising, yet the total price of a whole unit has actually fallen.
Start with PSF. Average transacted PSF for 4-bedroom-and-larger condos rose from $1,772 in 2019 to $2,206 in 2026, a cumulative +24.5% over eight years (with only a brief pandemic dip in 2020). Ultra-luxury units of 5 bedrooms and larger command an even higher PSF, reaching $2,355 in 2026 — slightly above the $2,184 for 4-bedroom units.
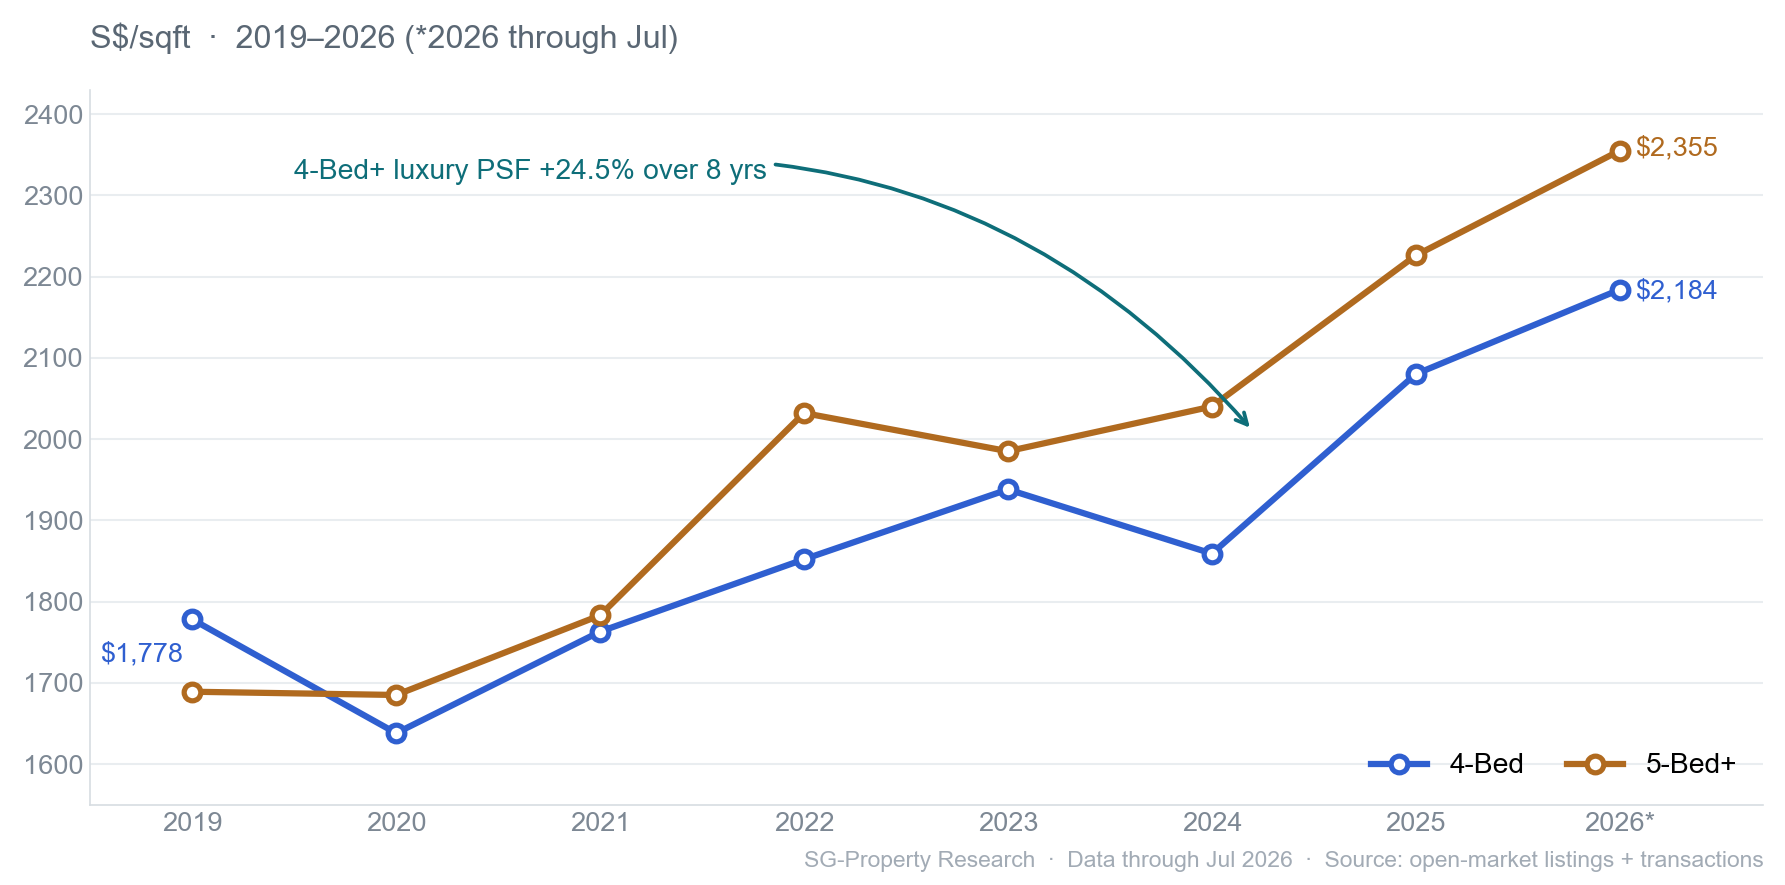
Now look at total price, and the story flips. For the same pool of 4-bedroom-and-larger luxury units, average unit size shrank from about 2,386 sqft in 2019 to about 1,778 sqft in 2026 — down roughly a quarter in eight years. That size compression outweighed the PSF gain, so average transacted price slipped from about $4.56M to about $4.01M (about −12.1%). In other words, today's "4-bedroom" is not the "4-bedroom" of old: floor plans are made smaller and more efficient, using a lower total-price threshold to reach a wider pool of buyers.
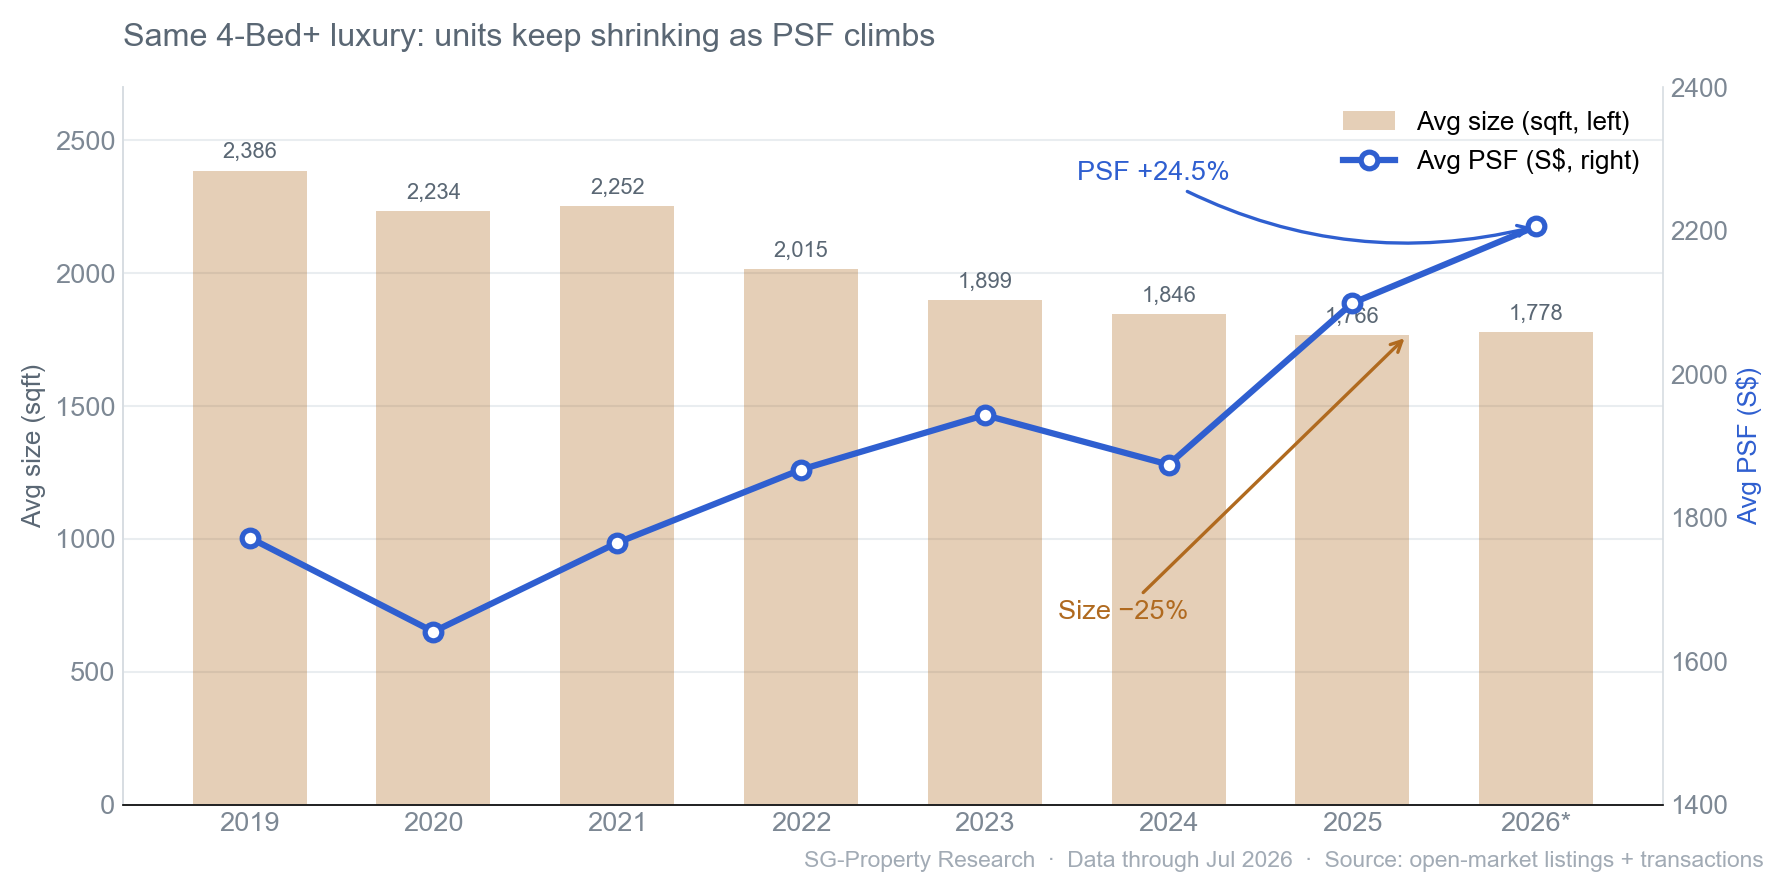
The "shrinking luxury unit": developers make large formats smaller and more compact, so PSF climbs step by step while the price of a whole unit drifts lower — the single most important thread for understanding the luxury market in recent years.
Transaction Volume
As the total-price threshold fell — compounded by upgrader and family demand — luxury transaction volume moved from niche to mainstream over eight years.
Annual volume for 4-bedroom-and-larger condos climbed from 596 units in 2019 to 2,209 units in 2025, about 3.7× (with pullbacks during the 2020 pandemic and the 2023 cooling, but an upward trend overall). Ultra-luxury units of 5 bedrooms and larger, though a niche, likewise grew from 41 to 291 units — an equally rapid expansion.
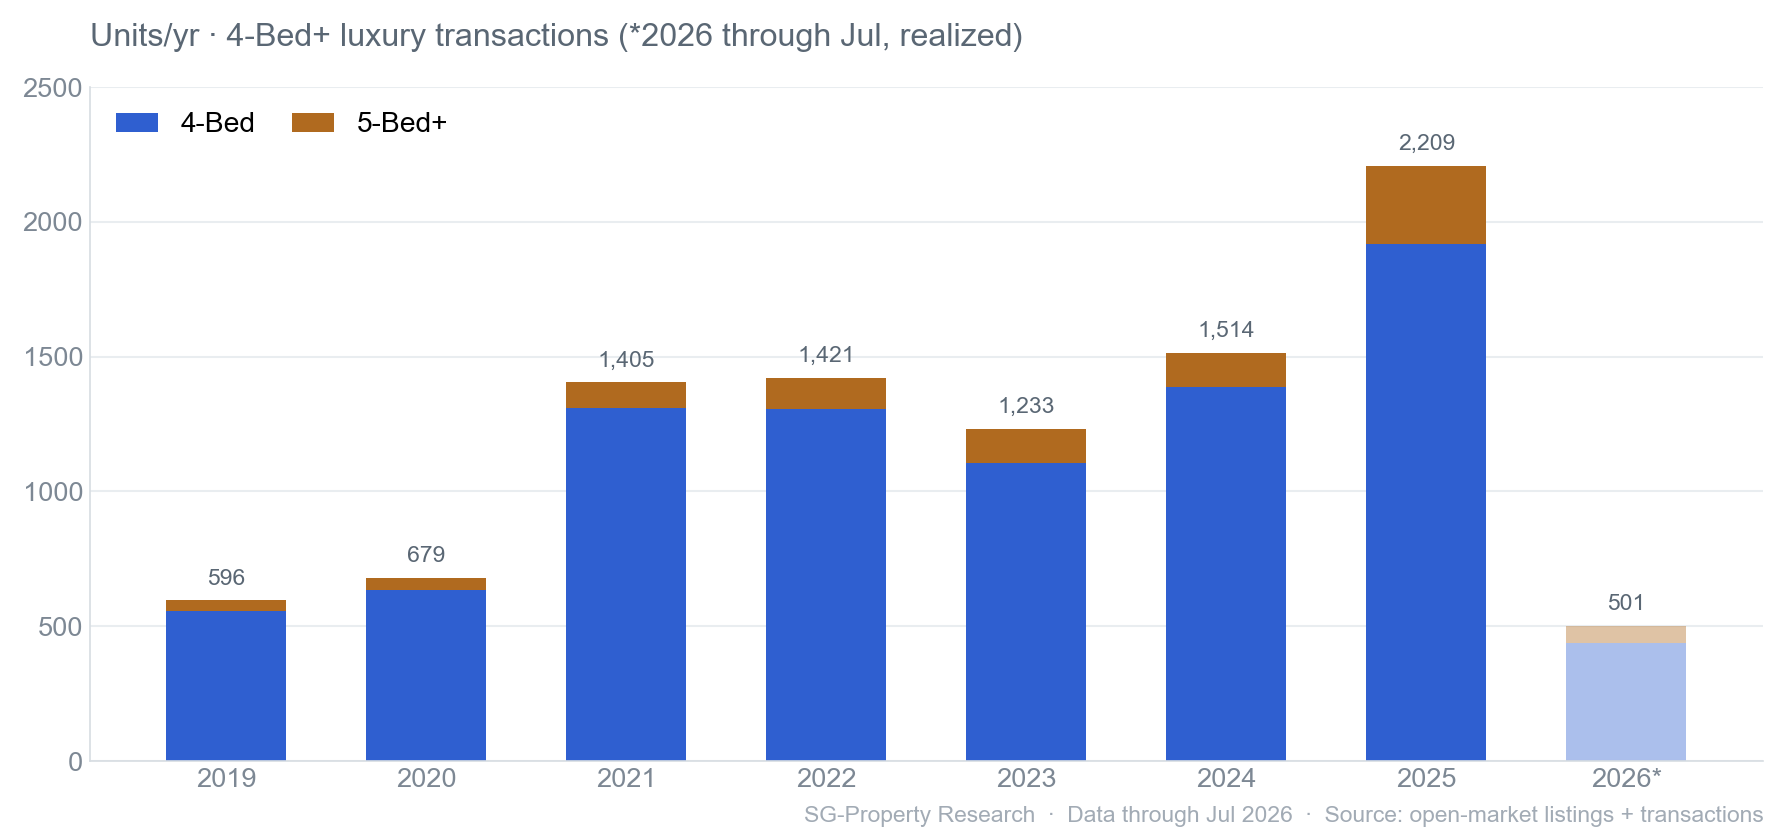
3.7× in eight years. Large formats are no longer a choice for the select few — improved total-price affordability plus family upgrader demand together pushed luxury transactions to a record high.
Market Segments
"Luxury" is not one market but three: collector-grade trophy homes in the core, upgrader-sized units in the central region, and family-sized large units outside the centre — with vastly different levels of health.
Measured by absorption period (current listing inventory ÷ average monthly transactions over the last 12 months; the healthy line is ≤6 months), liquidity forms a clear ladder across the three regions: OCR is fastest, CCR is slowest. Overall, 4-bedroom-and-larger units take about 62 months to absorb.
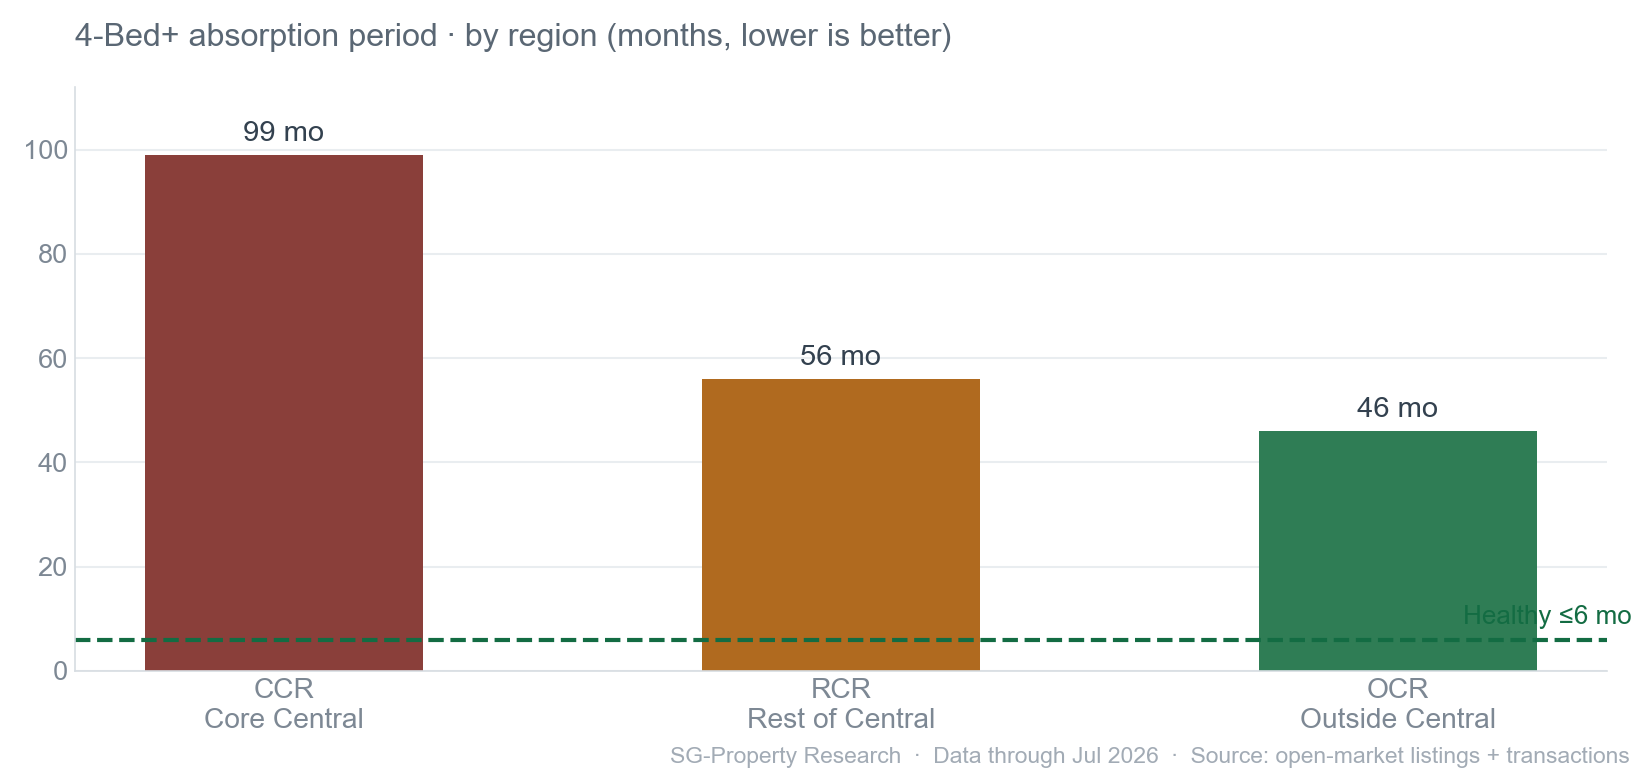
CCR (Core Central Region) trophy homes take as long as 99 months to absorb (≈8.3 years), carry a listing premium as high as +10.4%, and average about $8.25M per listing — scarce and resilient, but illiquid and hard to negotiate: the classic long-hold, collector-grade asset. OCR (Outside Central Region) family-sized units are the opposite: just 46 months to absorb, a slight +1.2% listing premium, and an average listing price of about $3.03M — the most accessible and easiest-to-resell tier of the luxury market. RCR sits in between.
| Region | Listing inventory | 12-mo transactions | Absorption | Listing / transacted PSF | Avg listing price | Listing premium | Status |
|---|---|---|---|---|---|---|---|
| CCR Core Central | 3,103 | 377 | 99 mo | $2,760 / $2,499 | $8.25M | +10.4% premium | Collector · slow |
| RCR Rest of Central | 2,774 | 591 | 56 mo | $2,427 / $2,307 | $4.23M | +5.2% premium | Upgrader · mid |
| OCR Outside Central | 2,605 | 680 | 46 mo | $1,897 / $1,875 | $3.03M | +1.2% premium | Family · fast |
Investment Implications
The trend is clear, but the right choice depends on the buyer — owner-occupier families, upgraders and collector-grade buyers are in fact pointed toward three completely different kinds of luxury home.
| Objective | Region | Core rationale |
|---|---|---|
| Own-stay · family home | OCR Outside Central | Fastest absorption at 46 mo, a slight +1.2% premium, ~$3.03M average — lowest threshold, easiest to resell |
| Upgrade · with location | RCR Rest of Central | 56-month absorption, ~$4.23M average — a balance of location and total price, the core upgrader band |
| Collect · scarce trophy | CCR Core Central | Scarce and resilient, but 99-month absorption, +10.4% premium, $8.25M average — needs a long horizon, ample cash, hard negotiation |
| Prioritise sheer size | Older resale stock | New launches keep shrinking, so genuinely large formats grow scarcer; buyers set on true size should look to older large-floorplate resale units |
FAQ
QHow much has PSF for Singapore 4-bedroom-and-larger luxury condos risen in recent years?
QWhy is luxury PSF rising while the average total price is falling?
QWhat is the volume trend for Singapore luxury (large-format) condos?
QWhich region is easiest to resell luxury in, and which is hardest?
QWhat should investors watch for with Core Central Region (CCR) trophy homes?
QWhat are the data sources, scope and time frame?
Notes & Sources
- Luxury scope
- Private condominiums/apartments of 4 bedrooms and larger (Condominium / Apartment), split into 4-bedroom and 5-bedroom-and-larger.
- Listing inventory
- Active public-market (is_alive) condo listings, aggregated by region.
- Transaction data
- Public-market historical transaction records (transaction date, price, PSF, size, unit type).
- Market segments
- CCR = D01, 02, 04, 06, 07, 09, 10, 11; RCR = D03, 05, 08, 12, 13, 14, 15, 20; OCR = the remaining postal districts.
- Absorption period
- Current listing inventory ÷ average monthly transactions over the last 12 months (in months). Healthy benchmark ≤6 months.
- Change basis
- PSF, size and total price are annual transaction averages; cumulative changes are indexed to 2019 as the base year.
Cite this report
PropertyWealth Research, "Singapore Luxury Condo Market Trends: 4-Bedroom and Larger Condominiums (2019–2026)," July 2026.
https://sg-property.ai/reports/singapore-luxury-condo-market-trends/en/
Looking for a large home with a low premium and a scarce floor plan?
Tell PropertyWealth your budget, preferred regions and unit type, and we'll combine live listings with public-market transactions to surface the best-value large-format homes for you.
Start chatting with AI — free →