Singapore Private Residential Market: 1-BR vs 2-BR Condominiums Inventory, transactions, absorption, price and listing premium compared (2020–2026)
- Price crossover: 2-BR average PSF started below 1-BR in 2020 ($1,531 vs $1,640) and overtook it by 2026 ($2,116 vs $1,938) — a six-year cumulative gain of +38.2%, 2.1× that of 1-BR (+18.2%).
- Transaction workhorse: 2-BR logged 3,752 transactions over the trailing 12 months, 2.5× the 1-BR total (1,524) — 313 vs 127 per month.
- Faster absorption: 2-BR clears in roughly 43 months (≈3.6 years) versus about 61 months (≈5.1 years) for 1-BR — despite nearly double the inventory, the 2-BR absorbs faster.
- Bargaining window: in the CCR, 2-BR listing PSF sits below transacted price (−0.3%) — the only discounted segment in the market, a rare buyer's window in the core region.
- Risk flag: 1-BR CCR carries an 88-month absorption period (≈7.3 years), the highest liquidity risk in the market.
Price Movement
Over the past six years, the price pecking order of 1-BR and 2-BR quietly reversed: the 1-BR, more expensive per square foot at the outset, was gradually overtaken by the 2-BR.
In 2020, 1-BR averaged $1,640 PSF, roughly $109 above the 2-BR's $1,531 — the familiar rule that "smaller units command higher per-square-foot prices" held at the start. But the 2-BR posted a larger gain almost every year thereafter: it drew level for the first time in 2023 ($1,898 vs $1,893), both pulled back in tandem in 2024 (1-BR −0.8%, 2-BR −2.7%), and the 2-BR then rebounded a decisive +9.5% in 2025 to complete the crossover. By 2026, 2-BR PSF reached $2,116, some $178 above the 1-BR's $1,938: the 2-BR's +38.2% six-year cumulative gain outran the 1-BR's +18.2% by roughly 2.1×.
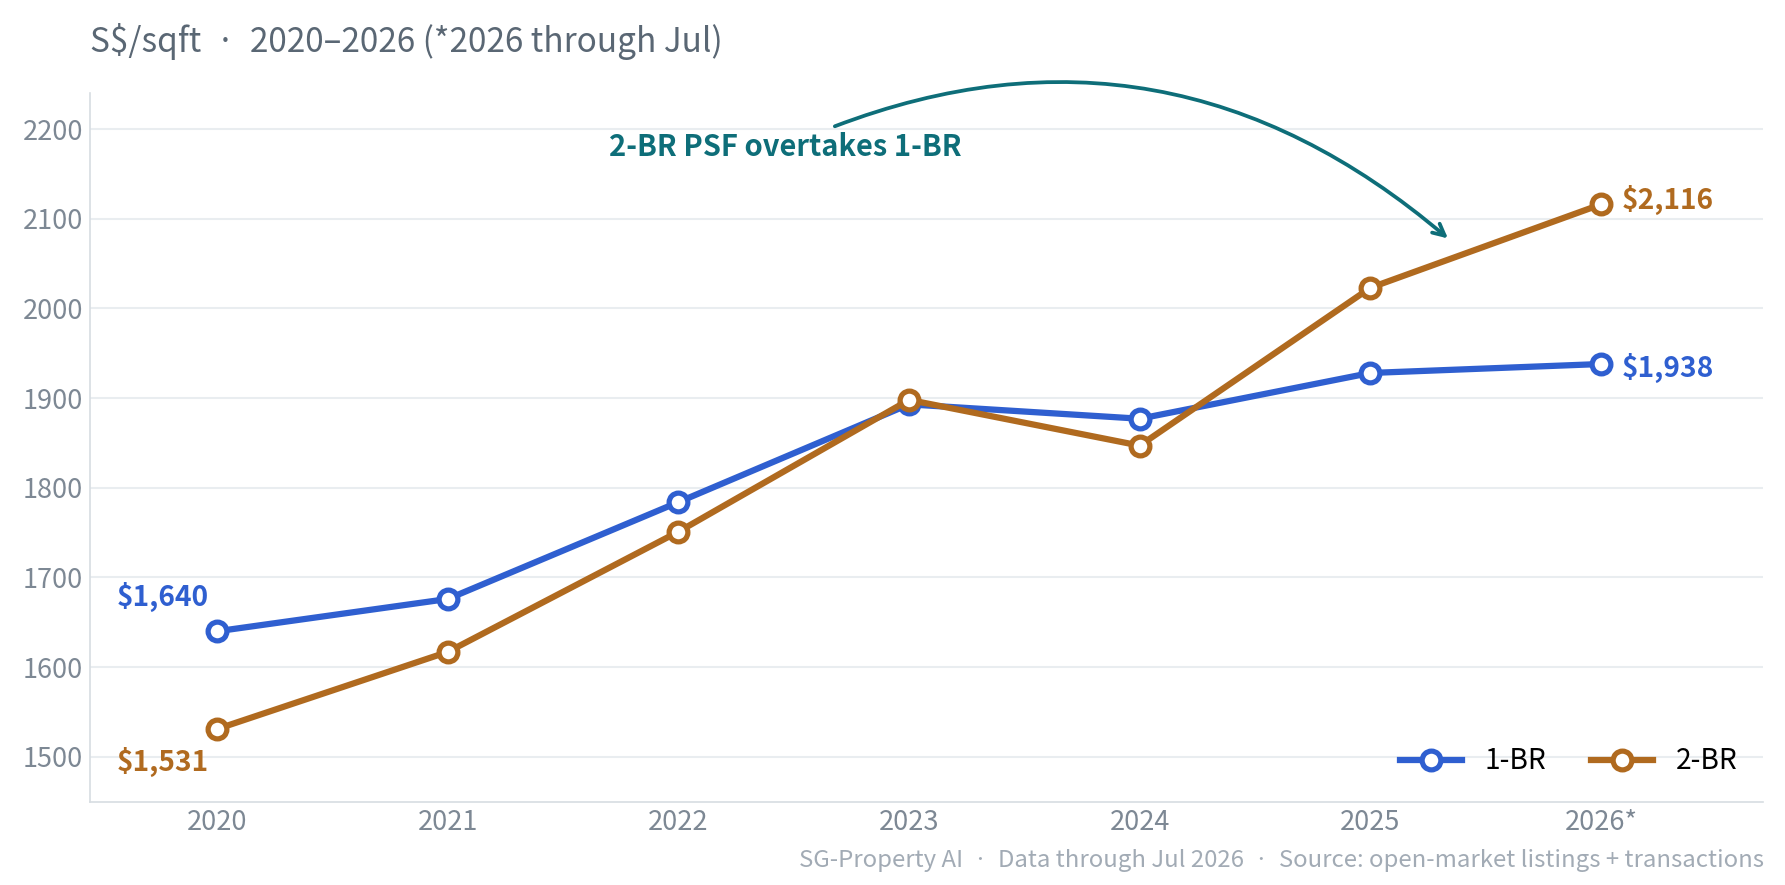
Broken down year by year, the 2-BR's year-on-year gains ran ahead of the 1-BR for most of the period; both dipped once in 2024, but the 2-BR fell deeper and rebounded harder, keeping a clear lead in net appreciation across the full cycle.
| Year | 1-BR txns | 1-BR PSF | 1-BR YoY | 2-BR txns | 2-BR PSF | 2-BR YoY |
|---|---|---|---|---|---|---|
| 2020 | 660 | $1,640 | — | 1,303 | $1,531 | — |
| 2021 | 1,503 | $1,676 | +2.2% | 3,065 | $1,617 | +5.6% |
| 2022 | 1,539 | $1,784 | +6.4% | 3,249 | $1,751 | +8.3% |
| 2023 | 1,633 | $1,893 | +6.1% | 3,091 | $1,898 | +8.4% |
| 2024 | 1,910 | $1,877 | -0.8% | 3,913 | $1,847 | -2.7% |
| 2025 | 2,243 | $1,928 | +2.7% | 5,115 | $2,023 | +9.5% |
| 2026* | 433 | $1,938 | +0.5% | 1,220 | $2,116 | +4.6% |
Volume & Absorption
Price is only half the story; whether a unit can actually sell is the other half. The 2-BR not only appreciated faster — it is the most heavily traded, most liquid "workhorse" layout in the entire market.
On volume, the 2-BR overwhelms the 1-BR: 2-BR transactions hit a six-year high of 5,115 units in 2025, against just 2,243 for the 1-BR over the same year; over the trailing 12 months the 2-BR averaged 313 transactions a month, 2.5× the 1-BR's 127. Sitting at the intersection of owner-occupier and genuine first-home demand, the 2-BR is the deepest transaction pool for buyers and sellers alike.
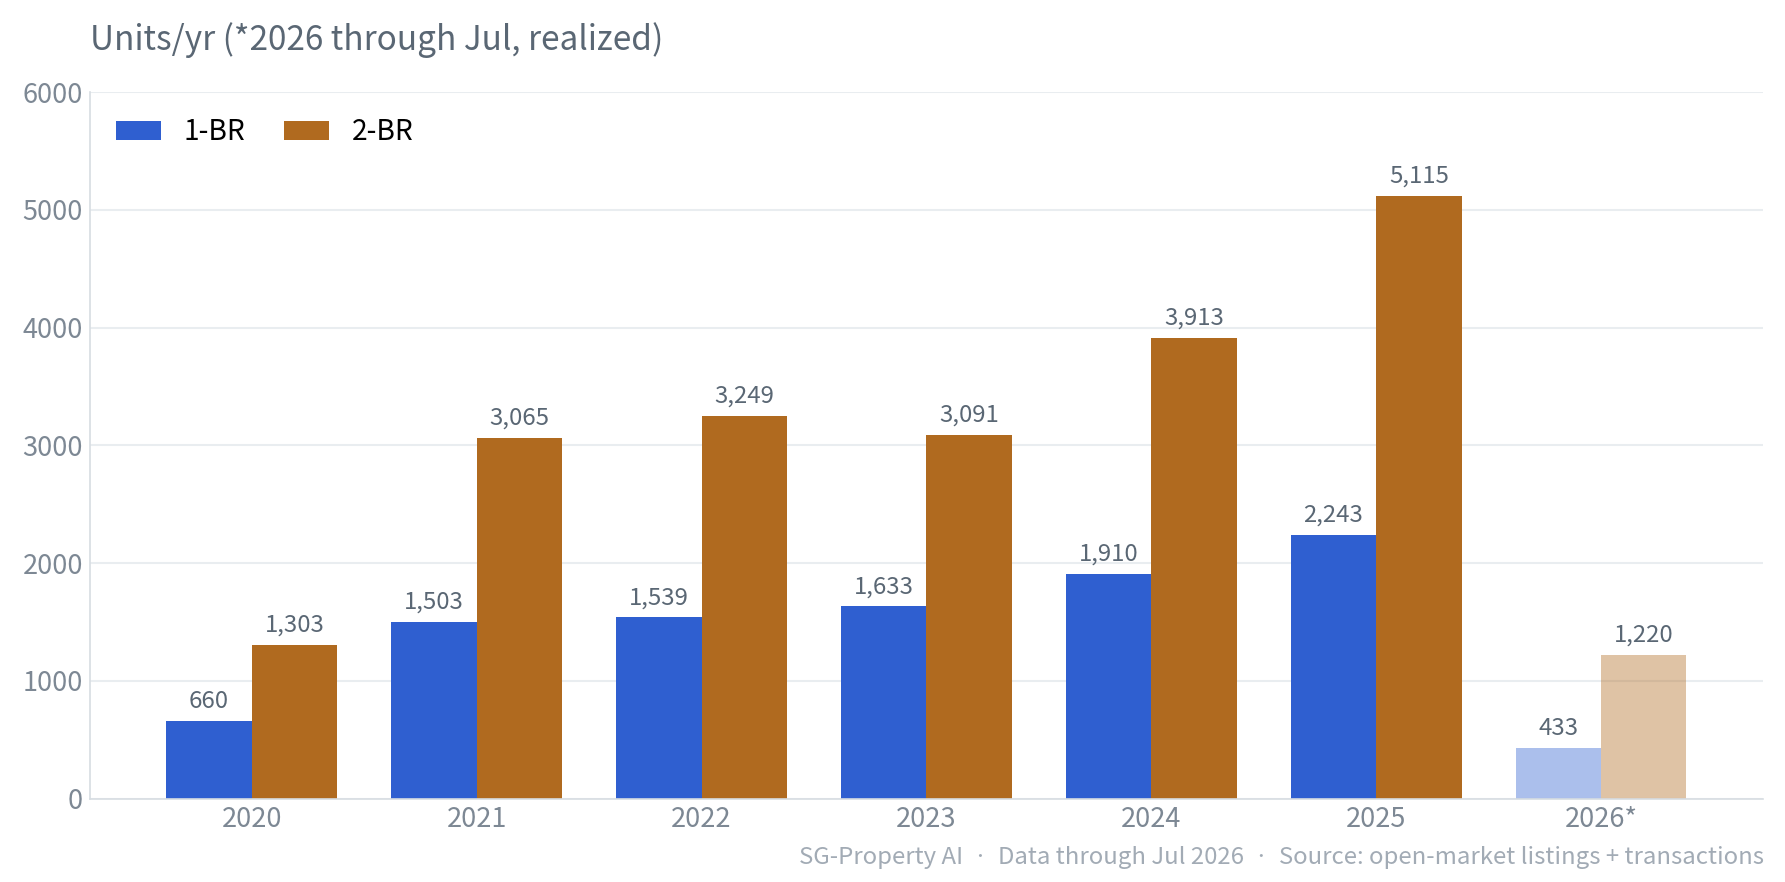
Absolute volume can be flattered by inventory size — the 2-BR pool is simply larger to begin with. A fairer health gauge is the absorption period (current listing inventory ÷ trailing-12-month monthly transactions), which measures how long it would take to clear the standing inventory at the current pace. A healthy market typically runs ≤6 months.
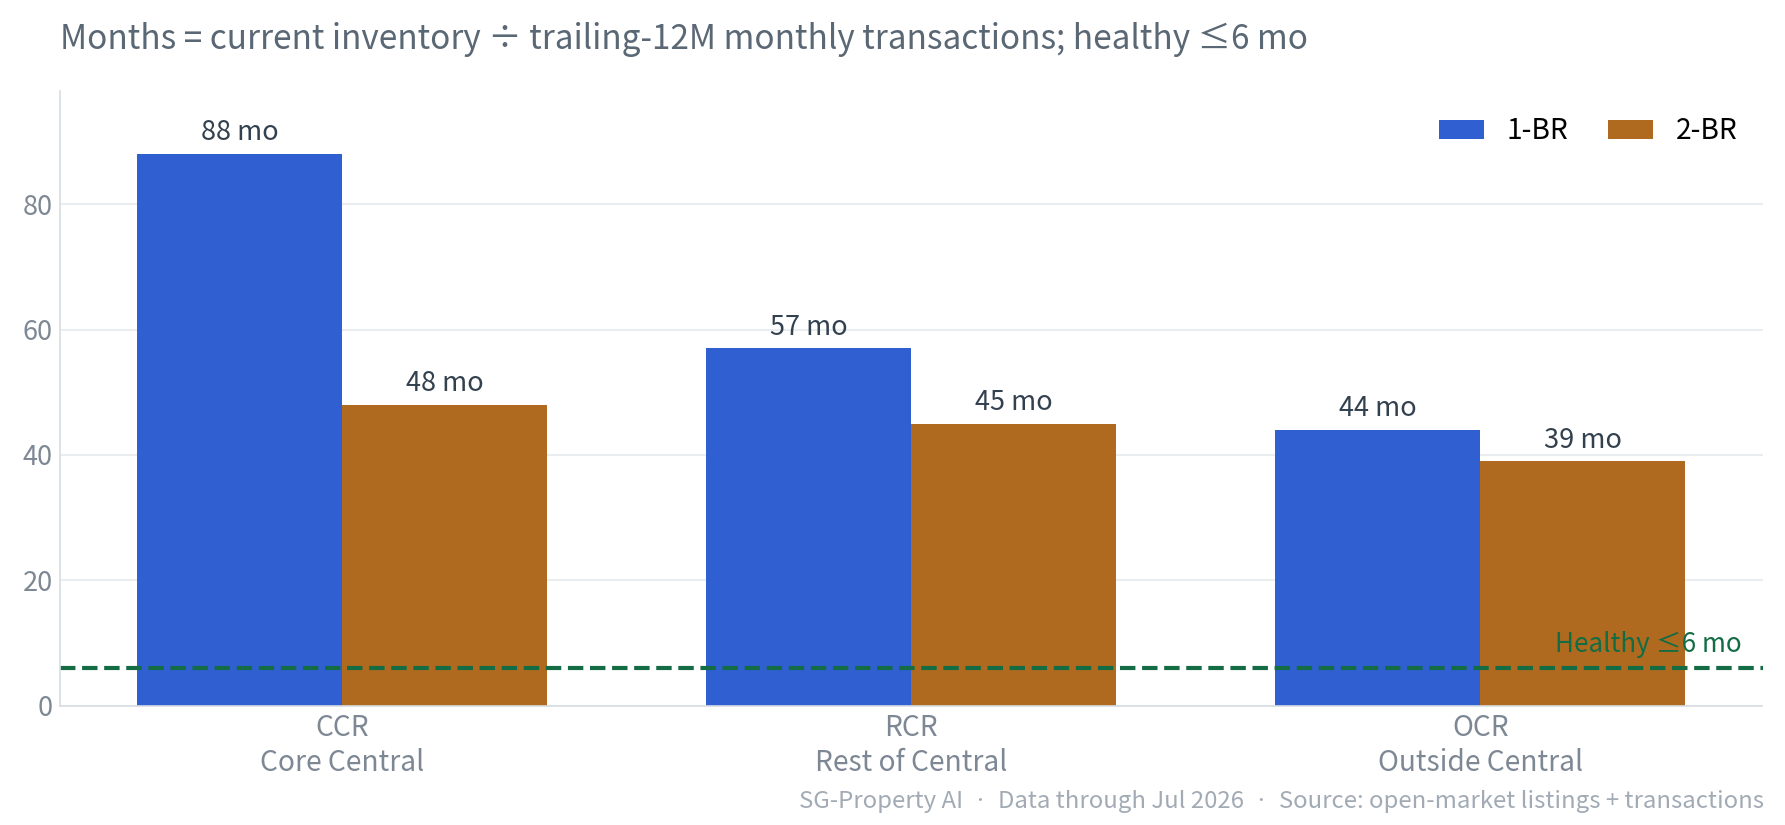
The 2-BR clears in about 3.6 years overall, the 1-BR in about 5.1. With inventory 1.8× that of the 1-BR, the 2-BR still absorbs faster — what truly determines market health is liquidity, not unit size.
Market Segments
Market-wide averages mask regional differences — inventory, absorption and bargaining room vary across the CCR, RCR and OCR.
Comparing "listing PSF" against "transacted PSF" reveals seller pricing psychology: a positive value means asking prices sit above recent transactions (a premium), while a negative value means asking prices sit below (a discount, leaving room for buyers to snap up bargains).
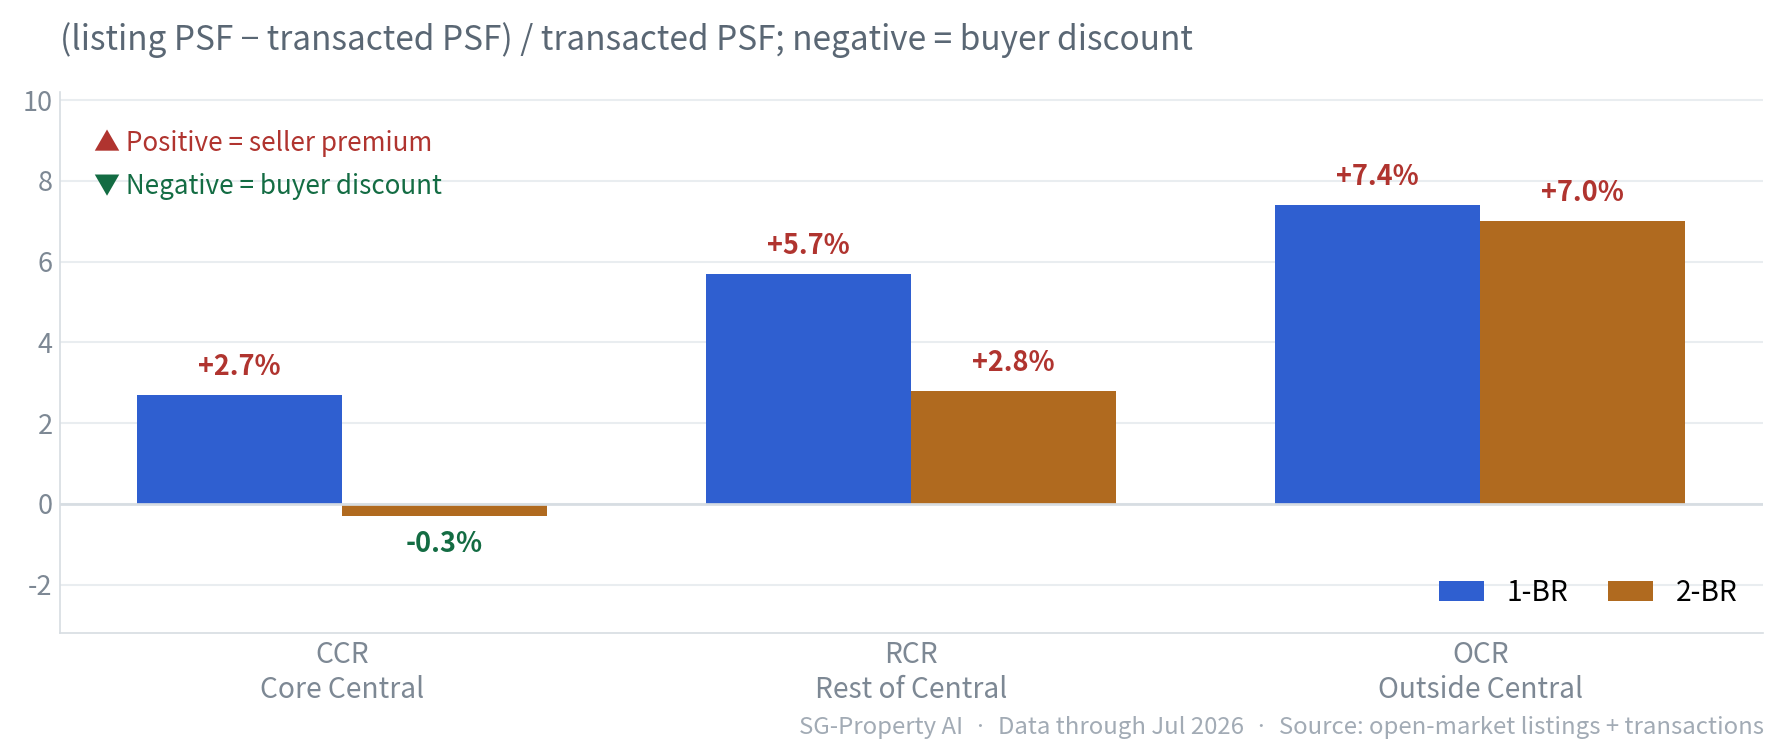
The signal is clear: 2-BR CCR is currently the only "buyer's market" — listing prices sit 0.3% below transacted prices, a rare bargaining window in the Core Central Region; 2-BR RCR carries a modest +2.8% premium. By contrast, 2-BR OCR carries a premium as high as +7.0% (where first-home demand runs hottest and sellers hold the strongest hand), and 1-BR RCR and OCR premiums also run +5.7% or higher — chasing these prices calls for caution. The table below lines up inventory, transactions, absorption and premium, laying bare the health of all six region × layout combinations at a glance.
| Region | Layout | Listing inventory | Trailing-12M txns | Absorption | Listing / transacted PSF | Listing premium | Status |
|---|---|---|---|---|---|---|---|
| CCR Core Central Region | 1-BR | 2,924 | 397 | 88 mo | $2,483 / $2,417 | +2.7% premium | Oversupply |
| 2-BR | 4,102 | 1,016 | 48 mo | $2,621 / $2,628 | -0.3% discount | Watch | |
| RCR Rest of Central Region | 1-BR | 2,840 | 599 | 57 mo | $2,062 / $1,950 | +5.7% premium | Oversupply |
| 2-BR | 4,964 | 1,334 | 45 mo | $2,223 / $2,162 | +2.8% premium | Watch | |
| OCR Outside Central Region | 1-BR | 1,937 | 528 | 44 mo | $1,742 / $1,622 | +7.4% premium | Watch |
| 2-BR | 4,500 | 1,402 | 39 mo | $1,790 / $1,673 | +7.0% premium | Watch |
Investment Implications
There is no absolutely "best" property, only the one that best matches your objective. The table below distils the conclusions of the previous three sections into an actionable side-by-side.
On the whole, the 2-BR wins on most counts — liquidity, appreciation and resale certainty; the 1-BR earns its place only when the lowest possible entry price is the goal, while 1-BR CCR is the one combination to actively avoid.
| Objective | Recommended layout | Region | Key rationale |
|---|---|---|---|
| Maximum liquidity | 2-BR | OCR (Outside Central) | Absorption of just 39 mo and 117 transactions a month — the most active, easiest-to-resell segment in the market |
| Core-region bargaining | 2-BR | CCR (Core Central) | The only listing discount at -0.3%, a rare buyer's window in the core region — you buy in with a built-in cushion |
| Capital appreciation | 2-BR | RCR (Rest of Central) | PSF up +38.2% over six years, 45-month absorption and a modest +2.8% premium — catch-up potential within the central region |
| Lowest entry price | 1-BR | OCR (Outside Central) | Average price around $920K, the lowest threshold; the fastest-absorbing 1-BR segment (44 months) |
| Avoid with caution | 1-BR | CCR (Core Central) | Absorption of 88 mo (≈7.3 yrs), 2,924 units of inventory against 397 annual transactions — extreme liquidity risk |
Frequently Asked Questions
QWhich is the better investment in Singapore — a 1-bedroom or a 2-bedroom condo?
QWhy has the 2-bedroom's per-square-foot price overtaken the 1-bedroom's?
QHow long is the absorption period for Singapore condos right now?
QWhere is there bargaining or bargain-hunting room for 2-bedroom units right now?
QWhich type carries the highest risk and warrants the most caution?
QWhat are the data sources, definitions and time frame?
Notes & Sources
- Listing inventory
- Publicly listed condominium / apartment units for sale, aggregated by layout and region.
- Transaction data
- Public-market historical transaction records (transaction date, price, PSF, area, layout).
- Market segments
- CCR = D01, 02, 04, 06, 07, 09, 10, 11; RCR = D03, 05, 08, 12, 13, 14, 15, 20; OCR = remaining postal districts.
- Absorption period
- Current listing inventory ÷ trailing-12-month monthly transaction volume (months). Healthy benchmark ≤6 months.
- Listing premium
- (average listing PSF − average transacted PSF) ÷ average transacted PSF; positive = premium, negative = discount.
- PSF growth
- Cumulative and year-on-year change in annual average transacted PSF; 2020 is the base year.
Cite this report
PropertyWealth Research Team, "Singapore Private Residential Market: 1-BR vs 2-BR Condominiums (2020–2026)", July 2026.
https://sg-property.ai/reports/singapore-condo-1-bedroom-vs-2-bedroom/en/
Want to know what your budget can buy?
Enter your budget, preferred region and layout, and PropertyWealth combines live listings with public-market transactions to surface low-premium, high-value homes for you.
Start asking AI for free →