Singapore Private Housing: 1-Bedroom vs 3-Bedroom Condos Inventory, transactions, absorption period, price and listing premium (2020–2026)
- Absorption period: 3-BR about 39 months (≈3.3 yrs), 1-BR about 61 months (≈5.1 yrs) — the larger 3-BR inventory clears faster.
- Transaction activity: 3-BR trailing-12-month transactions of 4,033 units, about 2.6× the 1-BR figure (1,524), or 336 vs 127 per month.
- Price growth: 3-BR PSF up +46.8% over six years, about 2.6× the 1-BR gain (+18.2%), with no annual decline in six years.
- Listing pricing: every segment lists slightly above recent transactions; 3-BR RCR is closest to par (+0.7%), OCR +2.0%, while 1-BR premiums are thicker (OCR +7.4%). The 3-BR edge is structural health, not a discount.
- Risk flag: 1-BR CCR absorption runs to 88 months (≈7 yrs) — the highest liquidity risk of any segment.
Price Movement
Over the past six years, 1-BR and 3-BR units traced opposite price paths: the smaller format opened high and drifted lower, the larger one opened low and climbed.
In 2020, 1-BR units averaged $1,639 PSF — about $247 above the 3-BR figure of $1,392, so the familiar "smaller unit, higher unit price" rule held at the outset. But 3-BR PSF then rose steadily almost every year, while 1-BR spiked in 2023 and slipped 0.8% in 2024. By 2026 the picture had fully reversed: 3-BR PSF reached $2,043, overtaking 1-BR's $1,938 by about $105 — a +46.8% six-year cumulative gain that outpaced the 1-BR's +18.2% by a factor of about 2.6.
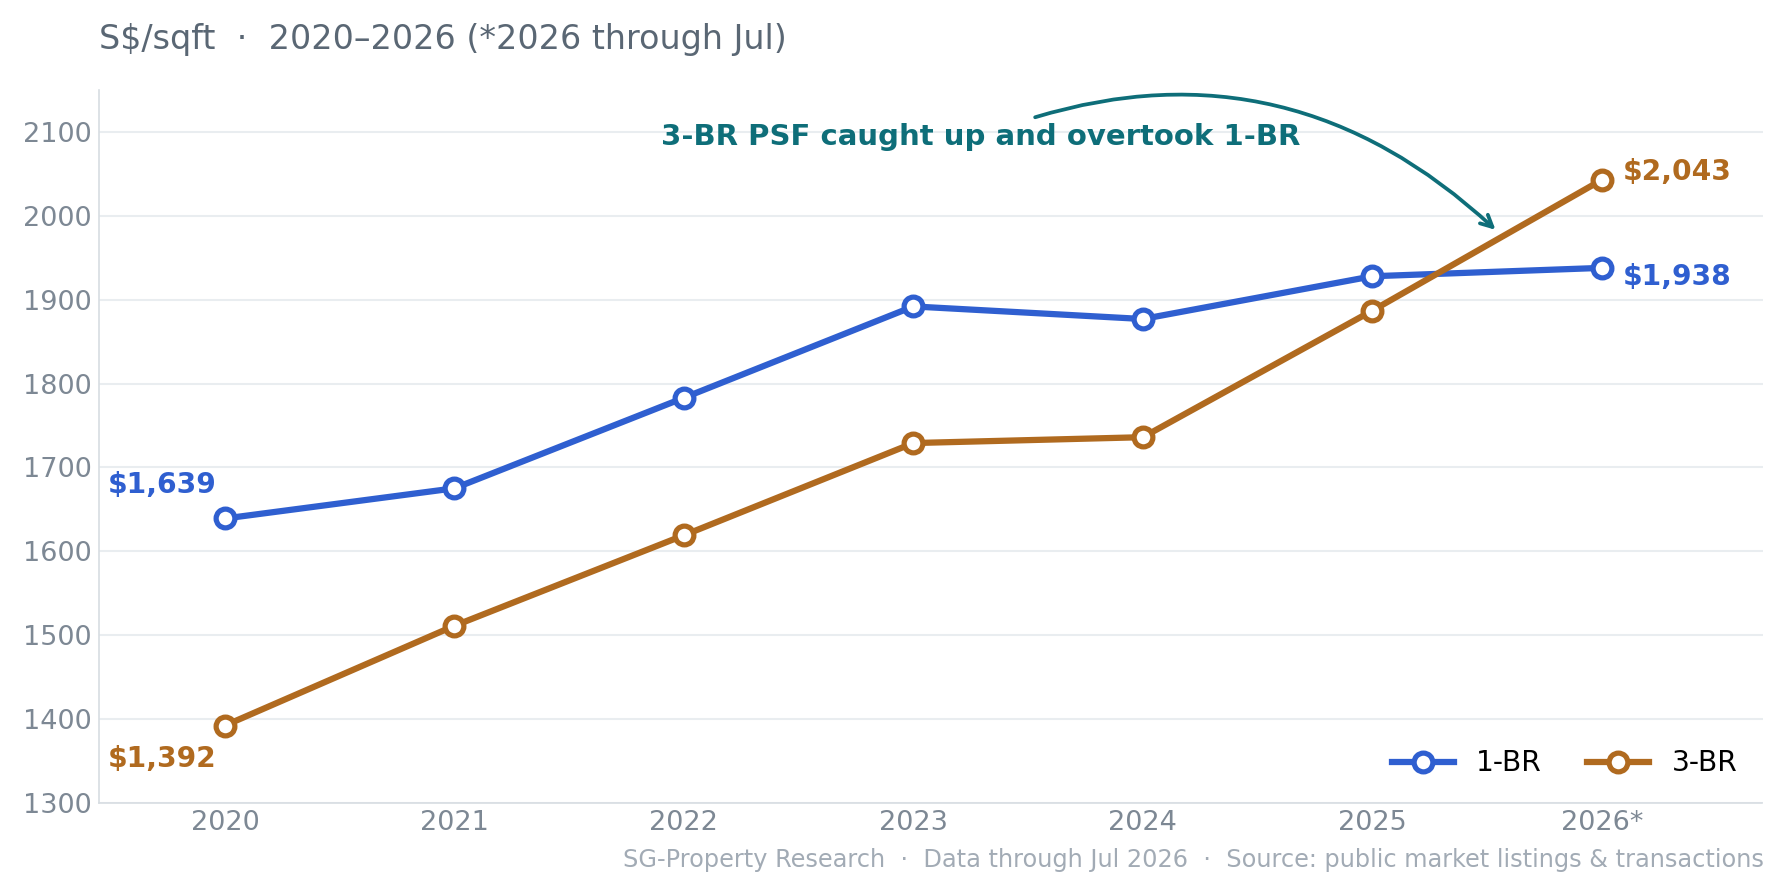
Broken out year by year, 3-BR year-on-year growth has consistently run ahead of 1-BR and never turned negative; 1-BR posted its only annual pullback in 2024.
| Year | 1-BR txns | 1-BR PSF | 1-BR YoY | 3-BR txns | 3-BR PSF | 3-BR YoY |
|---|---|---|---|---|---|---|
| 2020 | 663 | $1,639 | — | 1,995 | $1,392 | — |
| 2021 | 1,505 | $1,675 | +2.2% | 4,018 | $1,511 | +8.5% |
| 2022 | 1,545 | $1,783 | +6.4% | 3,964 | $1,619 | +7.1% |
| 2023 | 1,639 | $1,892 | +6.1% | 3,655 | $1,729 | +6.8% |
| 2024 | 1,911 | $1,877 | -0.8% | 4,602 | $1,736 | +0.4% |
| 2025 | 2,244 | $1,928 | +2.7% | 5,496 | $1,887 | +8.7% |
| 2026* | 433 | $1,938 | +0.5% | 1,373 | $2,043 | +8.3% |
Volume & Absorption
Price is only half the story; whether a unit actually sells is the other half. Fold transaction volume and inventory into an absorption period, and the 3-BR liquidity edge comes into full view.
On volume, 3-BR overwhelms 1-BR: 2025 3-BR transactions of 5,496 units set a six-year high, against just 2,244 for 1-BR; over the trailing 12 months 3-BR averaged 336 transactions a month, about 2.6× the 1-BR figure (127).
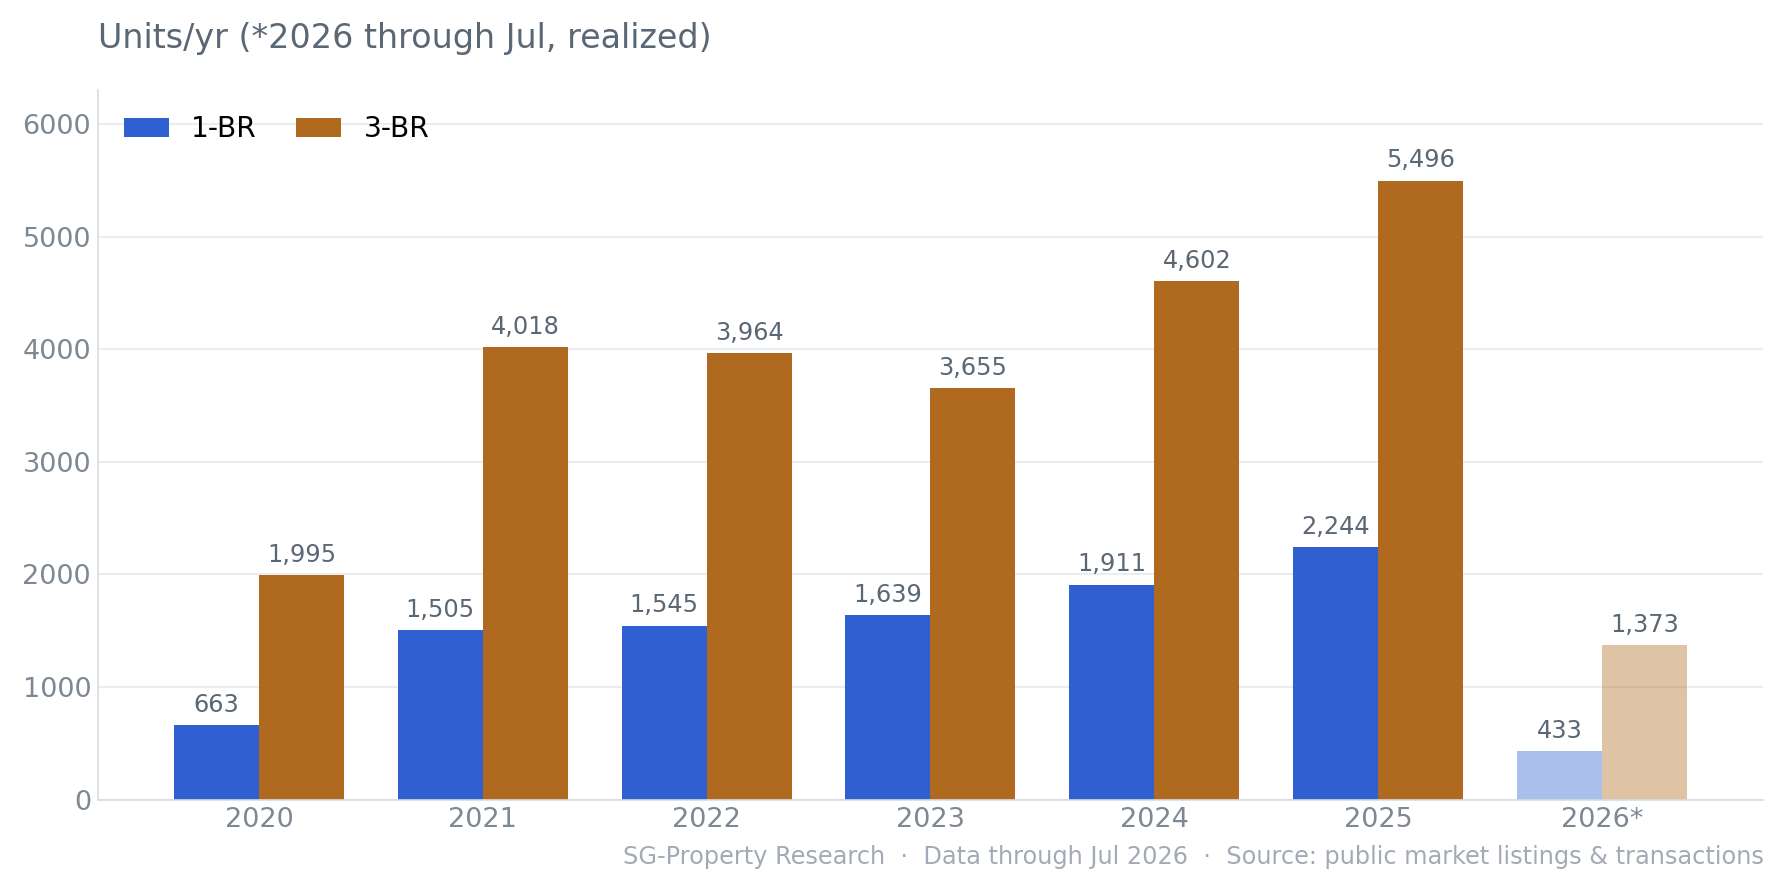
Absolute volume is masked by inventory scale — 3-BR stock is simply larger to begin with. A fairer health gauge is the absorption period (current listing inventory ÷ trailing-12-month monthly transactions), measuring how long it would take to clear listed inventory at the current pace. A healthy market typically sits at ≤6 months.
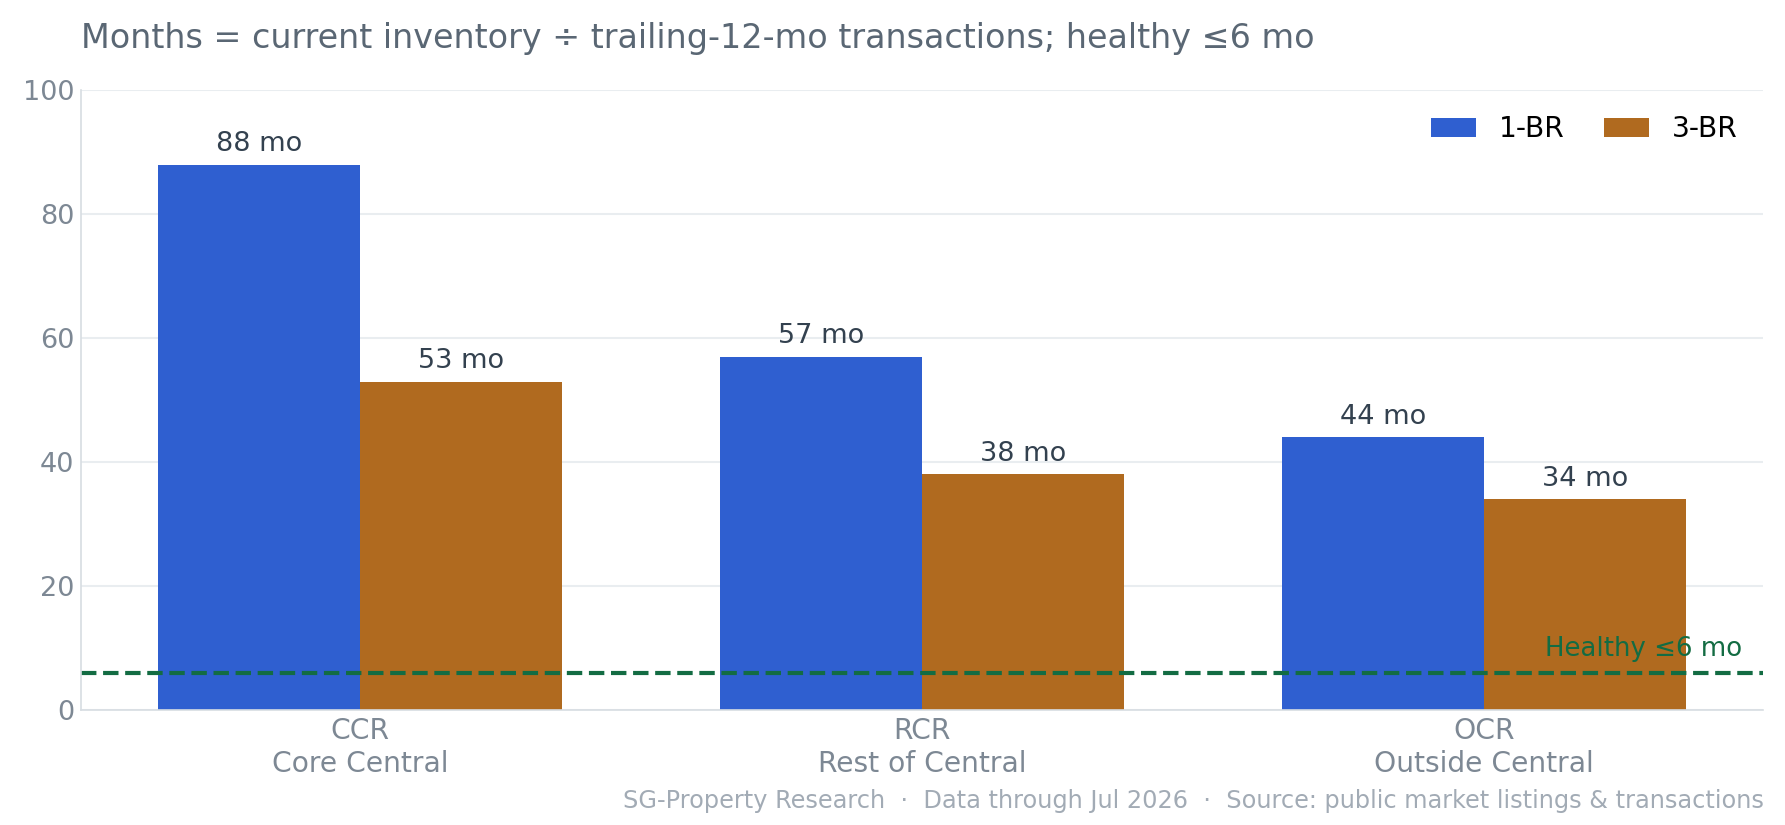
3-BR clears in about 3.3 years, 1-BR in about 5.1. The larger 3-BR inventory turns over markedly faster — market health is decided by liquidity, not by unit size.
Market Segments
A market-wide average hides regional variation — inventory, absorption and listing premium all differ across CCR, RCR and OCR.
Setting listing PSF against transacted PSF reveals seller pricing psychology: a positive value means asking prices sit above recent transactions (a premium); the closer to zero, the nearer to par. Across all six segment × unit-type combinations, listings sit slightly above recent transactions — there is no wholesale buyer discount, only thicker or thinner premiums.
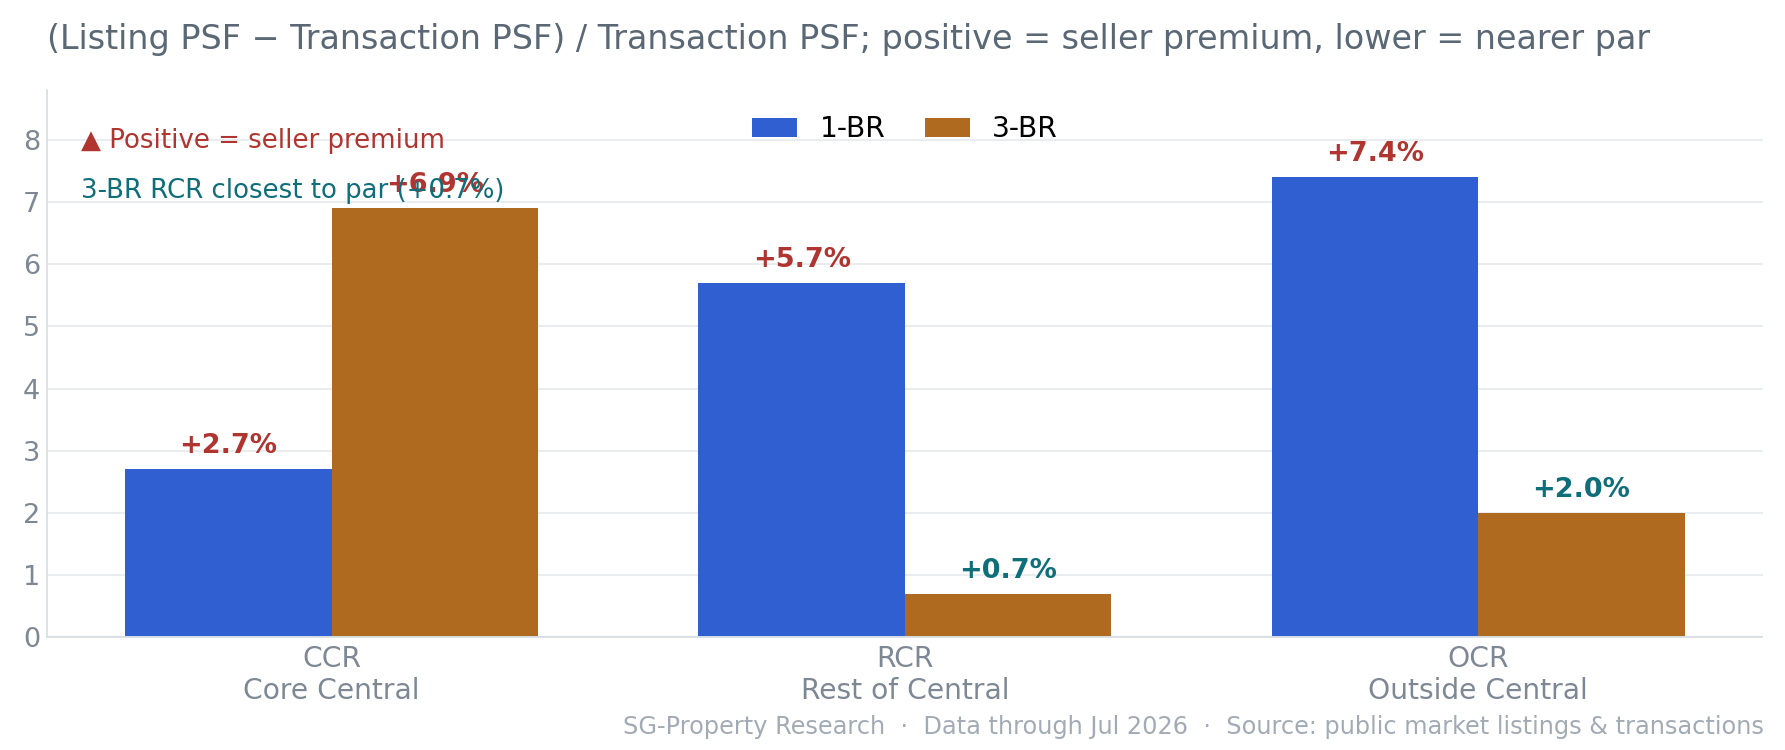
The signal is clear: every segment lists slightly above recent transactions, so there is no wholesale discount to be had; among them 3-BR RCR is closest to par (+0.7%) and 3-BR OCR next (+2.0%), the most restrained seller pricing. 1-BR premiums are thicker — OCR at +7.4%, RCR +5.7% — so chasing the price warrants caution. The real 3-BR advantage is not being cheap but structural health: faster absorption, stronger PSF growth and larger volume. The table below sets inventory, transactions, absorption and premium side by side, laying bare the health of all six "segment × unit type" combinations.
| Region | Type | Listing inventory | Trailing-12-mo txns | Absorption | Listing / Txn PSF | Listing premium | Status |
|---|---|---|---|---|---|---|---|
| CCR Core Central | 1-BR | 2,923 | 397 | 88 mo | $2,483 / $2,417 | +2.7% slight prem | oversupplied |
| 3-BR | 3,453 | 776 | 53 mo | $2,595 / $2,428 | +6.9% premium | oversupplied | |
| RCR Rest of Central | 1-BR | 2,838 | 599 | 57 mo | $2,062 / $1,950 | +5.7% premium | oversupplied |
| 3-BR | 4,404 | 1,379 | 38 mo | $2,160 / $2,144 | +0.7% near par | watch | |
| OCR Outside Central | 1-BR | 1,936 | 528 | 44 mo | $1,742 / $1,622 | +7.4% premium | oversupplied |
| 3-BR | 5,254 | 1,878 | 34 mo | $1,710 / $1,676 | +2.0% slight prem | watch |
Investment Implications
There is no absolute "best" property, only the one that best fits your goal. The table below distills the first three sections into an actionable comparison.
On balance, 3-BR comes out ahead under most objectives; 1-BR CCR is the single combination to actively avoid.
| Objective | Recommended type | Region | Core rationale |
|---|---|---|---|
| Maximum liquidity | 3-BR | OCR · Outside Central | Absorption 34 mo, ~156 units/mo — the most active in the market; listing premium just +2.0%, near par |
| Capital appreciation | 3-BR | RCR · Rest of Central | PSF up +46.8% over six years (1-BR just +18.2%), 38-mo absorption, listed near par (+0.7%) — strong on price, growth and liquidity |
| Low entry price | 1-BR | OCR · Outside Central | Average price ≈$919K, the lowest threshold; best liquidity among 1-BR (44-mo absorption) |
| Prime-district value | 3-BR | CCR · Core Central | Absorption 53 mo, well ahead of 1-BR CCR's 88 mo; scarce core-district stock, suited to long-term holding |
| Avoid with caution | 1-BR | CCR · Core Central | Absorption 88 mo (≈7 yrs), 2,923 units of inventory vs 397 annual transactions — extreme liquidity risk |
FAQ
QWhich is a better investment in Singapore — a 1-BR or 3-BR condo?
QHow long is the condo absorption period in Singapore now?
QBuying now, which unit type + region is easiest to resell?
QHow large is the listing premium (asking vs transacted PSF)?
QWhich segment carries the highest risk and warrants the most caution?
QWhat are the data sources, definitions and time frame?
Notes & Sources
- Listing inventory
- Publicly listed condos available for sale, aggregated by unit type and region.
- Transaction data
- Public market transaction records (transaction date, price, PSF, area, region).
- Absorption period
- Current listing inventory ÷ trailing-12-month monthly transactions (months). Healthy benchmark ≤6 months.
- Listing premium
- (Average listing PSF − average transacted PSF) ÷ average transacted PSF; positive = premium, negative = discount.
- PSF growth
- Cumulative and year-on-year change in each year's average transacted PSF; 2020 is the base year.
- Data cleaning
- Areas cross-validated; only 100–8,000 sqft retained, anomalous PSF excluded.
Cite this report
PropertyWealth Research, "Singapore Private Housing: 1-Bedroom vs 3-Bedroom Condos (2020–2026)," July 2026.
https://sg-property.ai/reports/singapore-condo-1-bedroom-vs-3-bedroom/en/
Want to know what your budget can buy?
Enter your budget, region and unit type, and PropertyWealth combines live listings with public market transactions to surface low-premium, high-value homes for you.
Start with AI for free →