Singapore Private Residential Market: 2-Bedroom vs 3-Bedroom Condos Inventory, transactions, absorption period, price and listing premium compared (2020–2026)
- Fastest price growth: 3-bedroom PSF rose +46.8% cumulatively over six years — the highest in the market, ahead of 2-bedroom (+38.2%). During the 2024 pullback it even edged up +0.4%, while 2-bedroom fell -2.7% over the same period.
- Gap narrowing: 2-bedroom average PSF is still above 3-bedroom (smaller units carry a higher unit price), but the gap has narrowed from $139 in 2020 to $73 in 2026.
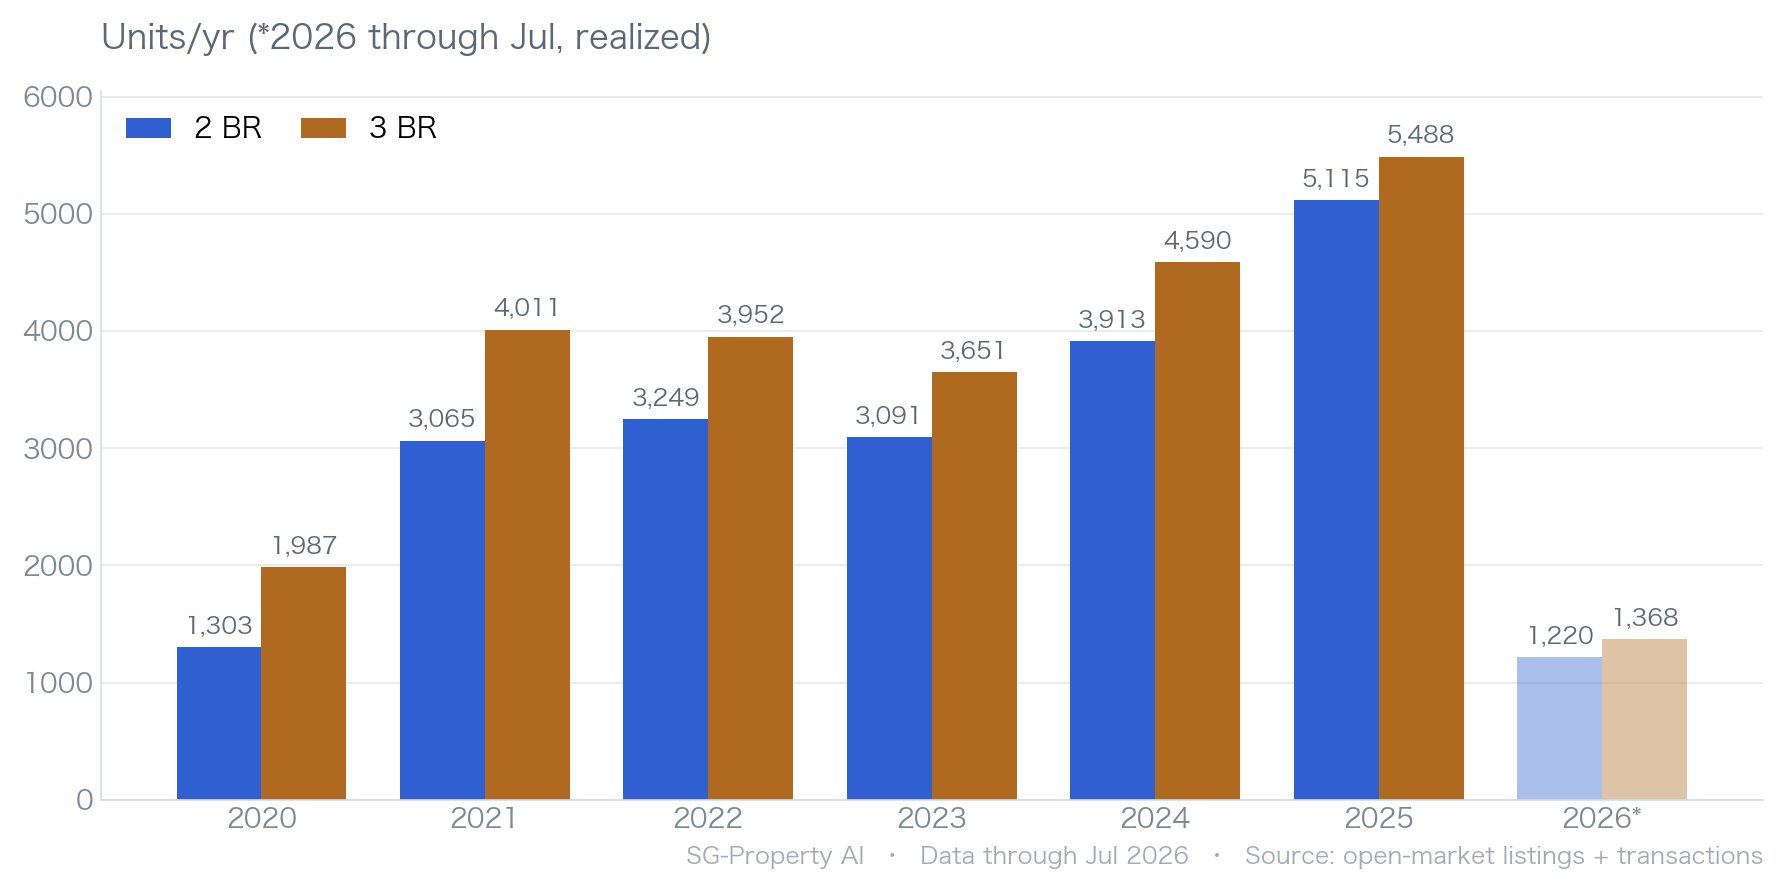
- Two mainstream segments: 3-bedroom and 2-bedroom are the market's two deepest transaction pools, with 4,033 / 3,752 units transacted over the trailing 12 months — comparable in scale (3-bedroom slightly higher).
- Similar absorption: 3-bedroom absorbs in about 39 months and 2-bedroom in about 43 months — close to each other, and both markedly faster than 1-bedroom (about 61 months).
- Bargaining splits by region: in the core look to 2-bedroom (CCR is the only discount, -0.3%); outside the central region look to 3-bedroom (RCR near par, OCR fastest absorption at 34 months).
Price Movement
2-bedroom and 3-bedroom are the market's two mainstream segments, and their prices have risen in lockstep over six years — but 3-bedroom has climbed harder, steadily closing its unit-price gap with 2-bedroom.
In 2020, 2-bedroom average PSF was $1,531, above 3-bedroom's $1,392 (a gap of about $139) — confirming the rule of thumb that larger units carry a lower unit price. Both then rose together, but 3-bedroom gained more almost every year, up +46.8% cumulatively over six years (the highest in the market) and beating 2-bedroom's +38.2%. Notably, during the 2024 pullback, 3-bedroom edged up +0.4% while 2-bedroom fell -2.7%, showing the downside resilience of larger owner-occupier units. By 2026, 2-bedroom PSF ($2,116) is still above 3-bedroom ($2,043), but the gap has narrowed from $139 to $73.
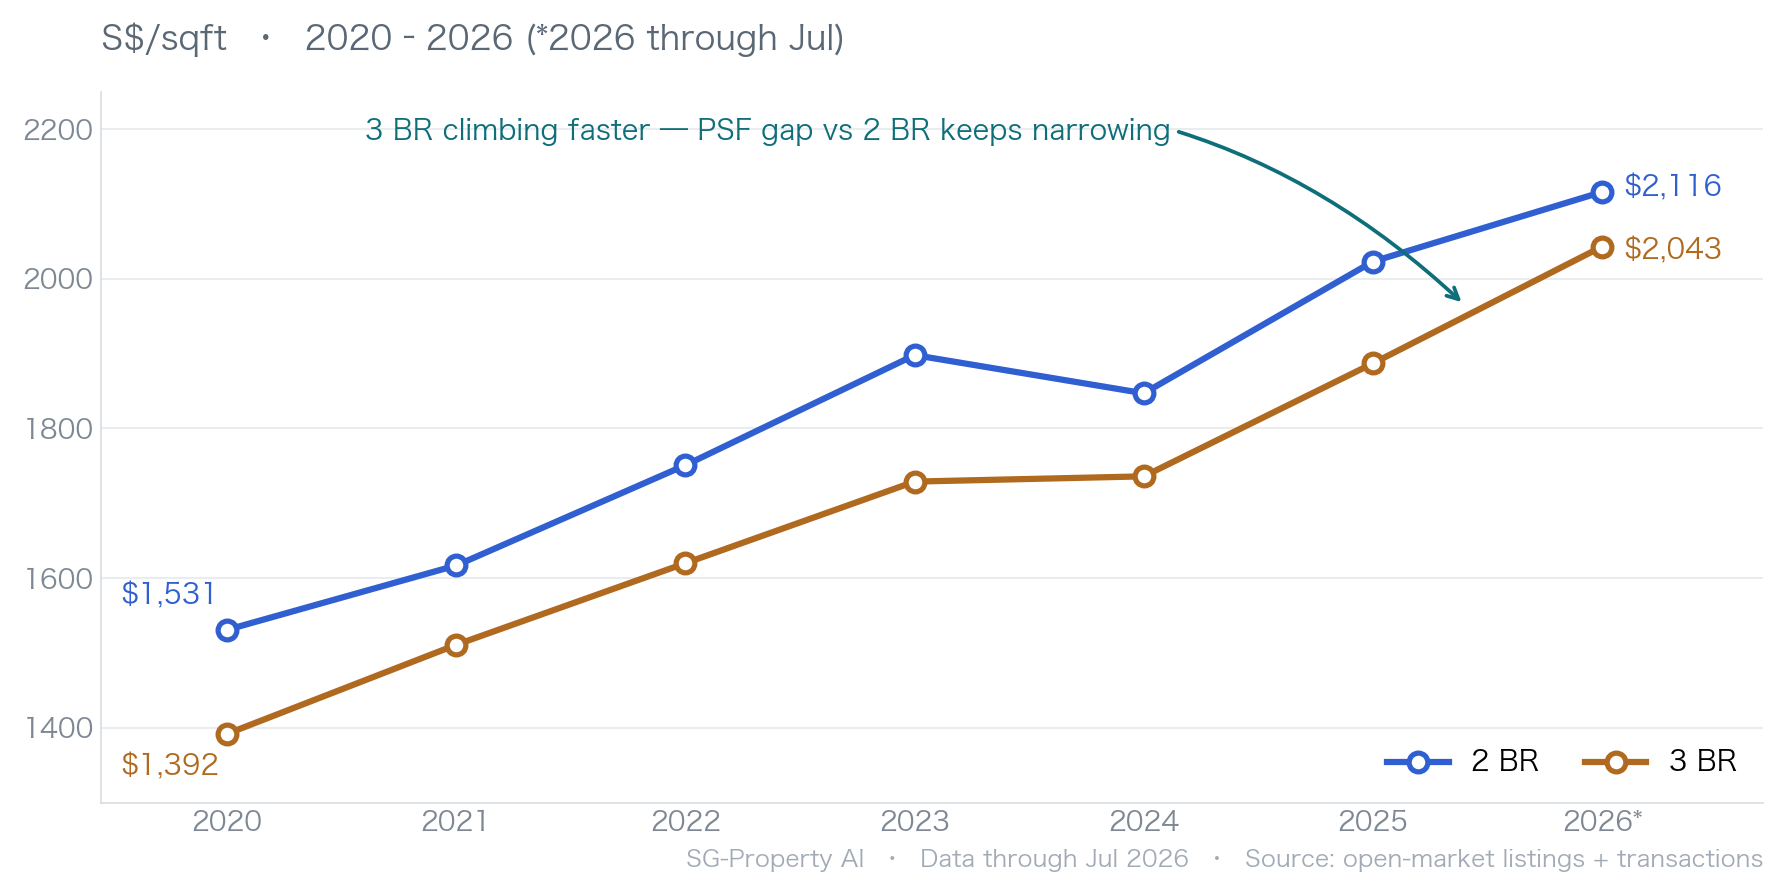
Broken down year by year, 3-bedroom's year-on-year gains have consistently matched or exceeded 2-bedroom's, and it was the only side not to fall in 2024; 2-bedroom saw a single pullback in 2024, then rebounded strongly by +9.5% in 2025.
| Year | 2BR txns | 2BR PSF | 2BR YoY | 3BR txns | 3BR PSF | 3BR YoY |
|---|---|---|---|---|---|---|
| 2020 | 1,303 | $1,531 | — | 1,987 | $1,392 | — |
| 2021 | 3,065 | $1,617 | +5.6% | 4,011 | $1,511 | +8.5% |
| 2022 | 3,249 | $1,751 | +8.3% | 3,952 | $1,620 | +7.2% |
| 2023 | 3,091 | $1,898 | +8.4% | 3,651 | $1,729 | +6.7% |
| 2024 | 3,913 | $1,847 | -2.7% | 4,590 | $1,736 | +0.4% |
| 2025 | 5,115 | $2,023 | +9.5% | 5,488 | $1,887 | +8.7% |
| 2026* | 1,220 | $2,116 | +4.6% | 1,368 | $2,043 | +8.3% |
Volume & Absorption
On transaction depth, 2-bedroom and 3-bedroom are the two deepest pools in the market and comparable in scale; both also absorb far more healthily than 1-bedroom.
In 2025, 3-bedroom transacted 5,488 units and 2-bedroom 5,115 — both record highs. Over the trailing 12 months, 3-bedroom averaged 336 transactions a month and 2-bedroom 313, with 3-bedroom slightly ahead. Together they carry the vast majority of private-residential volume and form the most active trading band for buyers and sellers alike.
Factoring in inventory gives the absorption period (current listed inventory ÷ trailing-12-month average monthly transactions — how long it would take to clear the for-sale inventory at the current pace; a healthy market is usually ≤6 months): about 39 months for 3-bedroom and 43 months for 2-bedroom. The gap is small, but both clearly beat 1-bedroom's 61 months — both are liquid, mainstream unit types.
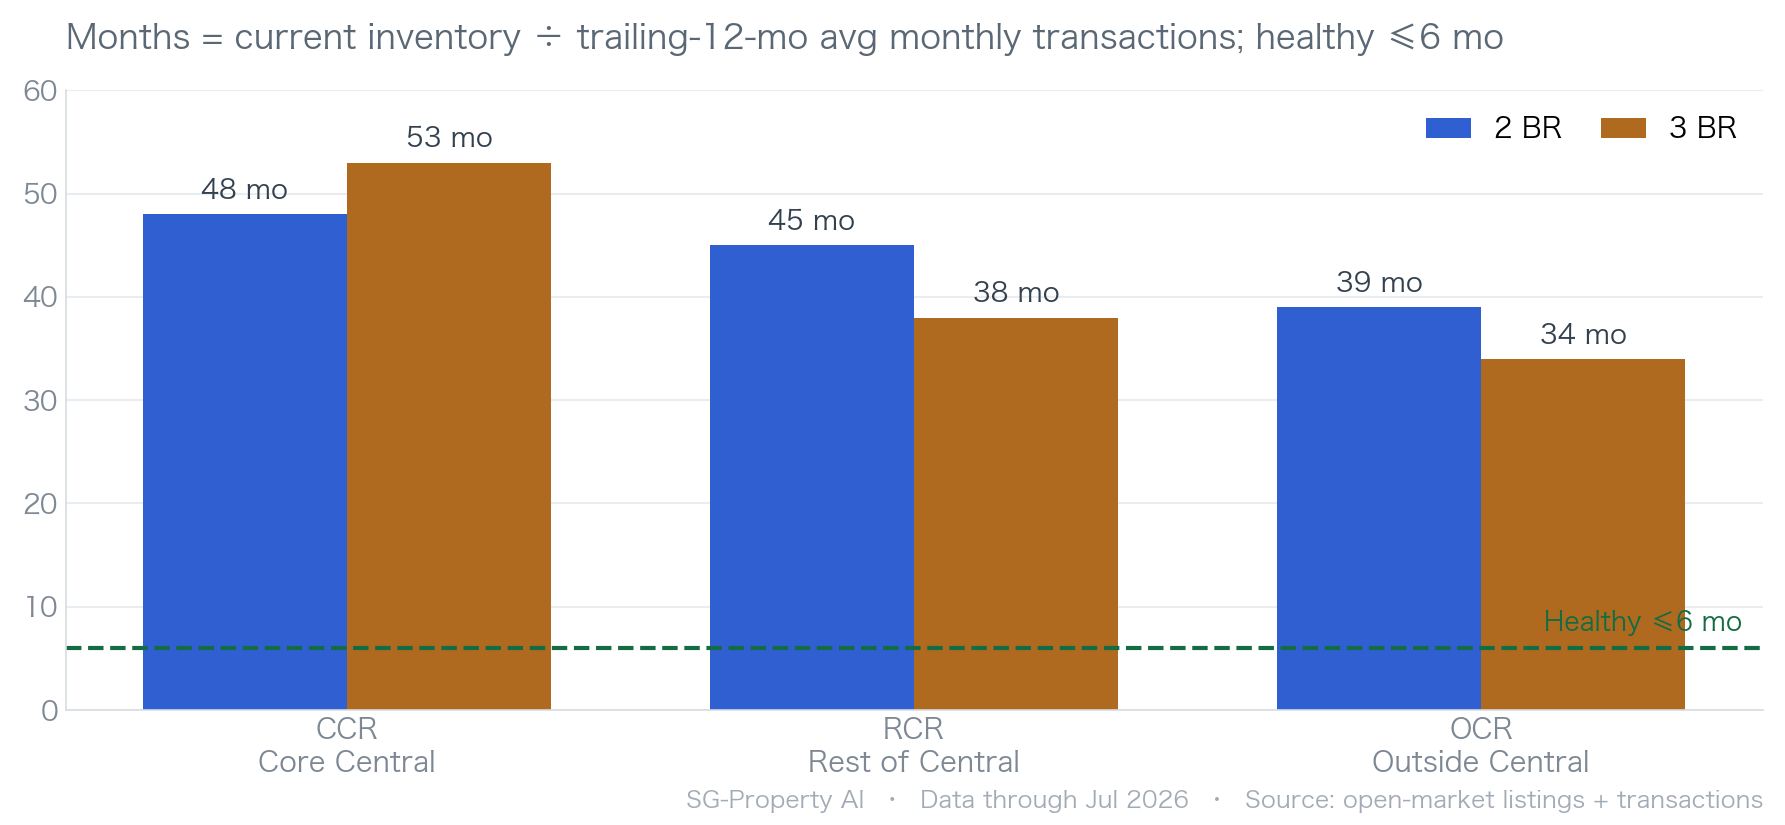
3-bedroom clears in about 3.3 years overall and 2-bedroom in about 3.6 years — the two mainstream segments are close in health, with 3-bedroom slightly ahead. Against 1-bedroom's 5.1 years, both are the more liquid choice.
Market Segments
Market-wide averages hide regional differences — across CCR, RCR and OCR, the bargaining room for 2-bedroom and 3-bedroom is almost exactly reversed.
Comparing "listing PSF" with "transacted PSF" reveals sellers' pricing stance: a positive figure means asking prices sit above recent transactions (a premium), while a negative figure means asking prices sit below transactions (a discount — room for buyers to find a bargain).
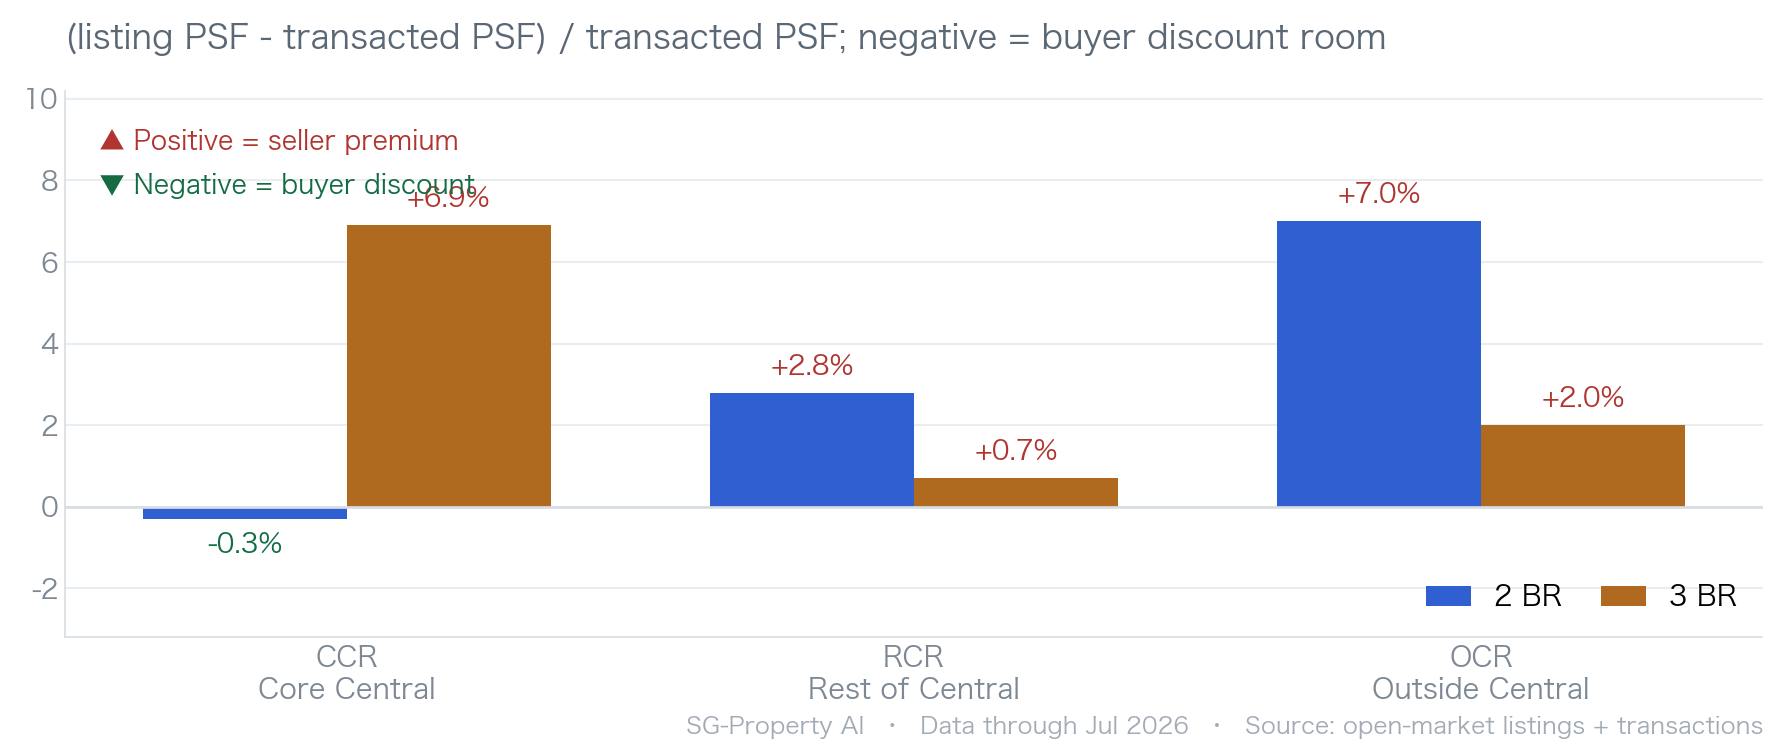
The signal is intriguing: in the core (CCR) look to 2-bedroom; outside the central region look to 3-bedroom. In the CCR, 2-bedroom is the only combination listing at a discount (-0.3%), whereas 3-bedroom CCR asks high (+6.9% premium), absorbs slowest (53 months) and carries the heaviest price tags (about $4.0M on average). Move out to RCR and OCR and the pattern flips — 3-bedroom RCR is near par (+0.7%) and 3-bedroom OCR absorbs fastest (34 months), making it the value pocket among larger units. The table below places inventory, transactions, absorption and premium side by side, laying bare the health of all six "region × unit-type" combinations.
| Region | Unit type | Listed inventory | Trailing-12mo txns | Absorption | Listing / txn PSF | Listing premium | Status |
|---|---|---|---|---|---|---|---|
| CCR Core Central | 2BR | 4,102 | 1,016 | 48 mo | $2,621 / $2,628 | -0.3% discount | Watch |
| 3BR | 3,451 | 776 | 53 mo | $2,595 / $2,428 | +6.9% premium | Watch | |
| RCR Rest of Central | 2BR | 4,964 | 1,334 | 45 mo | $2,223 / $2,162 | +2.8% slight premium | Watch |
| 3BR | 4,400 | 1,379 | 38 mo | $2,160 / $2,144 | +0.7% near par | Active | |
| OCR Outside Central | 2BR | 4,499 | 1,402 | 39 mo | $1,790 / $1,673 | +7.0% premium | Active |
| 3BR | 5,252 | 1,878 | 34 mo | $1,709 / $1,676 | +2.0% slight premium | Active |
Investment Implications
2-bedroom and 3-bedroom are both healthy mainstream segments with no outright winner — the difference is your objective. The table below distills the conclusions of the previous three sections into an actionable comparison.
In short: for capital appreciation and downside resilience, look to 3-bedroom; for a lower total price and core-region bargaining, look to 2-bedroom. The one combination that demands extra patience is 3-bedroom CCR (large-ticket, slow-selling).
| Objective | Recommended type | Region | Key rationale |
|---|---|---|---|
| Capital appreciation · resilience | 3BR | RCR (Rest of Central) | PSF +46.8% over six years (market's highest), didn't fall in 2024, 38-month absorption and near par (+0.7%) |
| Prioritizing liquidity | 3BR | OCR (Outside Central) | absorption of just 34 months, ~156 units a month — the most active in the market |
| Core-region bargaining | 2BR | CCR (Core Central) | the only clear discount, -0.3% — a rare buyer's window in the core |
| Lower total price · high liquidity | 2BR | OCR / RCR | total price about $1.38M–1.69M (vs about $1.97M–2.53M for 3-bedroom), a lower entry point, 39–45-month absorption |
| Requires extra patience | 3BR | CCR (Core Central) | absorption of 53 months (the slowest), +6.9% premium, ~$4.0M average price — large-ticket and slow-selling |
Frequently Asked Questions
QWhich is the better investment in Singapore — a 2-bedroom or a 3-bedroom condo?
QWhy is the per-square-foot price (PSF) of a 3-bedroom lower than a 2-bedroom?
QHow long is the absorption period for 2-bedroom and 3-bedroom condos right now?
QWhere is there room to bargain or find a deal on 2-bedroom and 3-bedroom units now?
QWhat risks should I watch for when buying a 3-bedroom condo?
QWhat are the data sources, definitions and time frame?
Notes & Sources
- Listed inventory
- Publicly listed for-sale condominiums / apartments, aggregated by unit type and region.
- Transaction data
- Public-market historical transaction records (transaction date, price, PSF, area and unit type).
- Market regions
- CCR = D01, 02, 04, 06, 07, 09, 10, 11; RCR = D03, 05, 08, 12, 13, 14, 15, 20; OCR = the remaining postal districts.
- Absorption period
- Current listed inventory ÷ trailing-12-month average monthly transactions (in months). Healthy benchmark ≤6 months.
- Listing premium
- (average listing PSF − average transacted PSF) ÷ average transacted PSF; positive = premium, negative = discount.
- PSF growth
- Cumulative and year-on-year change in average transacted PSF by year; 2020 is the base year.
Cite this report
PropertyWealth Research, "Singapore Private Residential Market: 2-Bedroom vs 3-Bedroom Condos (2020–2026)," July 2026.
https://sg-property.ai/reports/singapore-condo-2-bedroom-vs-3-bedroom/en/
Want to know what your budget can buy?
Enter your budget, region and unit type, and PropertyWealth combines live listings with public-market transactions to surface low-premium, high-value homes for you.
Start asking AI for free →