Singapore Private Residential Market Overview Transactions, Prices, the Absorption Truth & Market Segments (2021–2026)
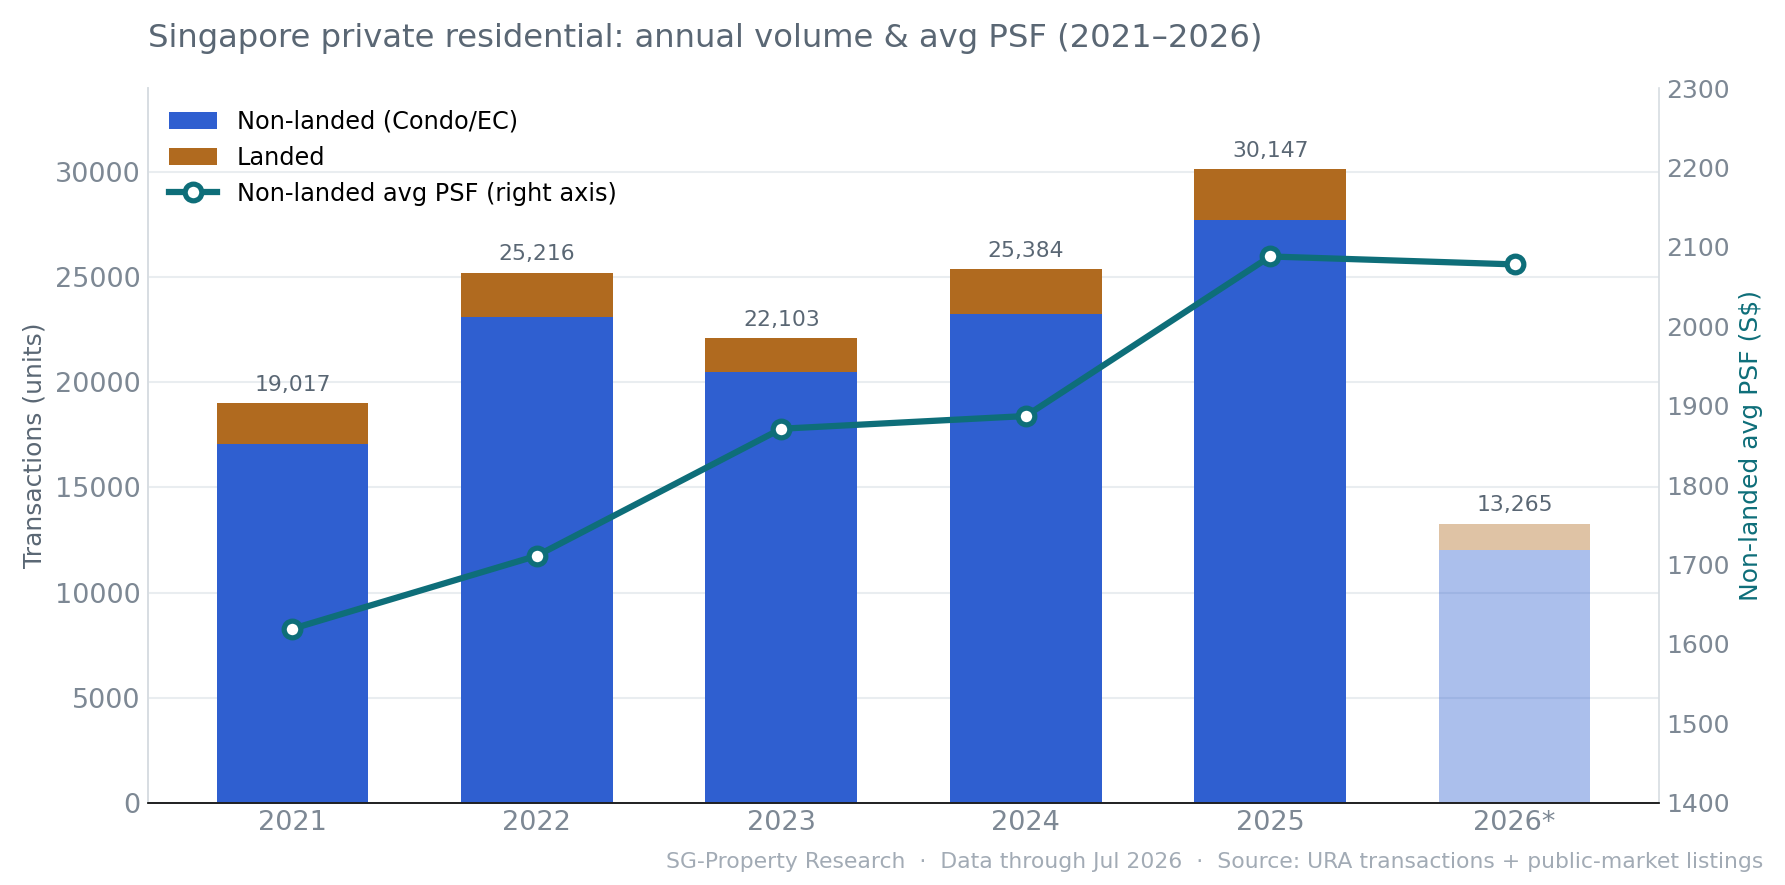
- Market size: Singapore private residential transactions reached about 30,000 units in 2025, a multi-year high; the non-landed (condo/EC) average PSF rose a cumulative +28.4% over five years ($1,619 → $2,078).
- The absorption truth (this report's core): counting new launches, market-wide absorption reads just 20 months; strip them out and count resale only, and it stretches to 38 months — nearly double, and this is the true resale liquidity.
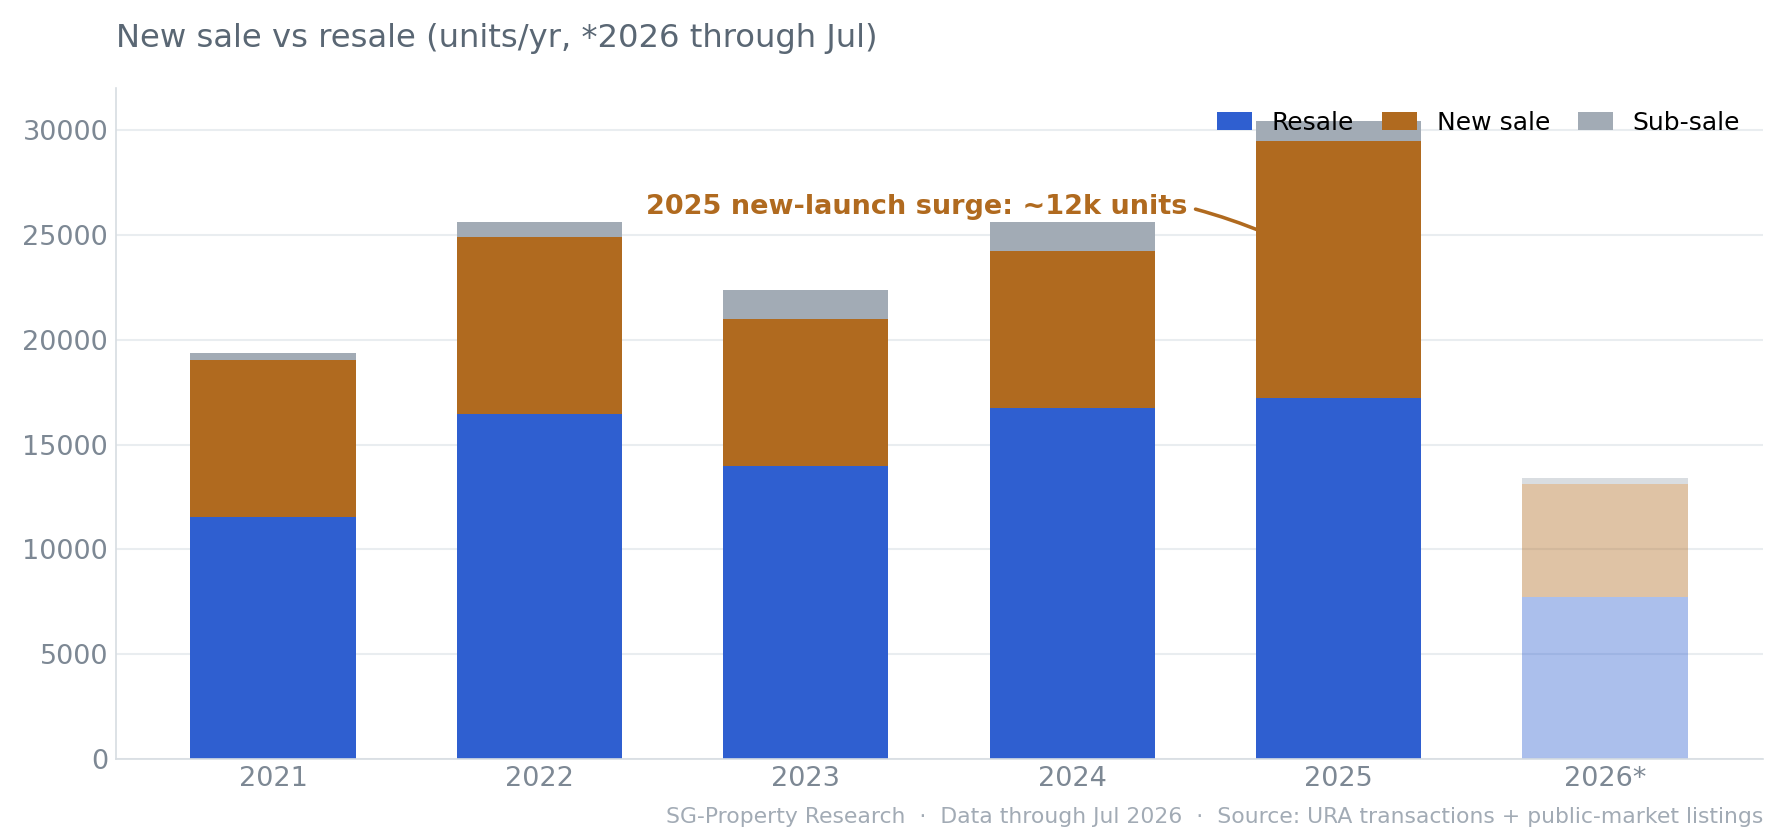
- The new-launch flood: new-launch transactions surged to about 12,000 units in 2025; concentrated releases sped up overall transactions and masked the resale market's absorptive capacity.
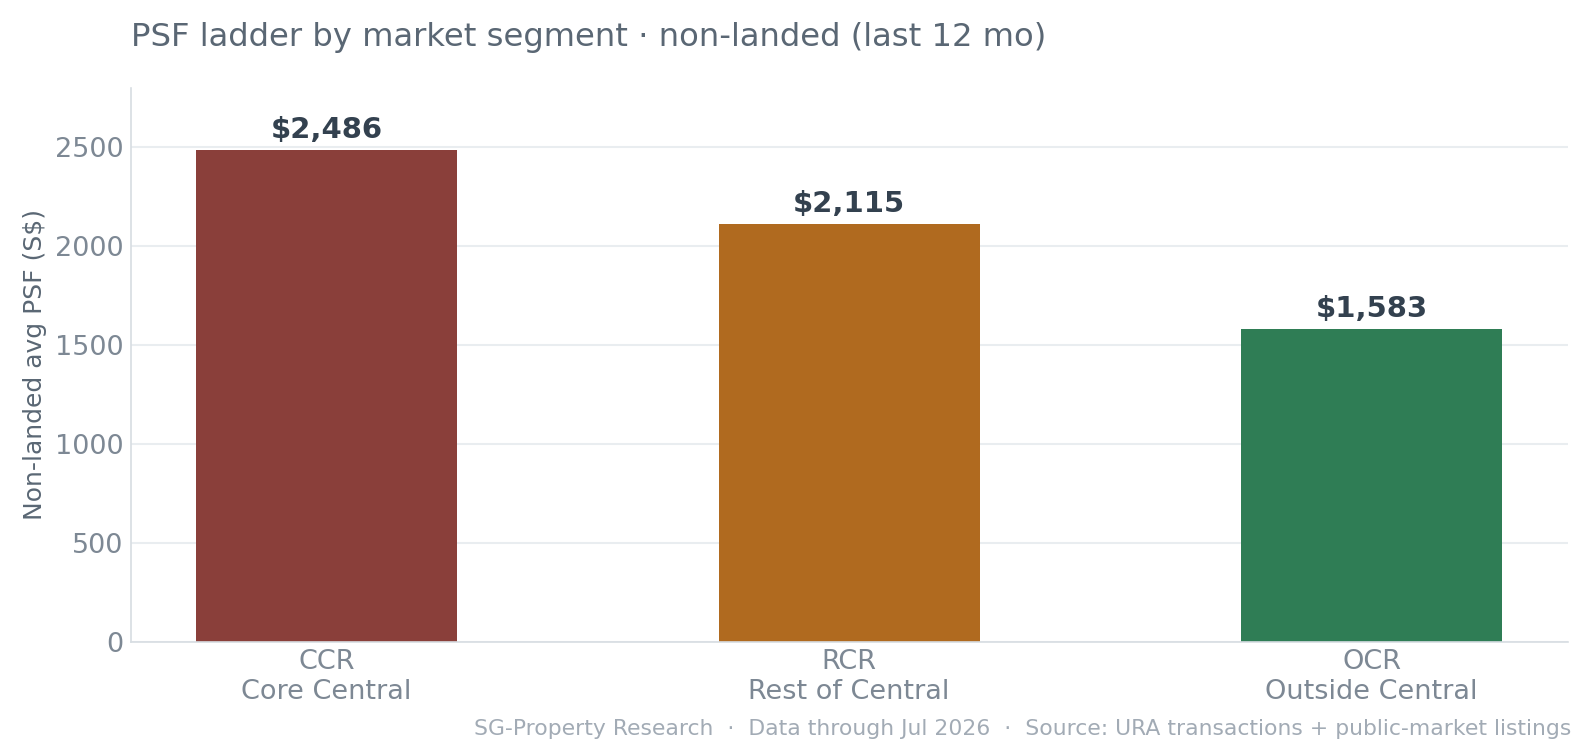
- Segment divergence: OCR resale absorption of about 23 months is the most active, while CCR at about 72 months is the hardest to clear; the average PSF ladder runs CCR $2,486 › RCR $2,115 › OCR $1,583.
- Category mix: condos about 78%, ECs about 12%, landed about 8%; for each category's trends, see the deep-dive report links at the end.
Market Overview
Over the past five years, Singapore's private residential market has steadily expanded in volume and climbed in price, with non-landed homes (condos and ECs) as the overwhelming majority.
Annual transaction volume rose from about 19,000 units in 2021 to about 30,000 units in 2025; non-landed homes make up more than 90% of this, while landed homes total roughly two thousand a year — scarce and infrequently traded. On price, the non-landed average transacted PSF climbed steadily from $1,619 to $2,078, a five-year +28.4% (flattening only slightly in the first half of 2026).
New Sale vs Resale
To understand Singapore's private residential market, you first have to look at "new sale" and "resale" separately — their rhythms and meanings are entirely different.
Resale is a continuous flow of secondary-market trades, whereas new launches are released by developers all at once, with transactions bunching together. New-launch transactions surged to about 12,000 units in 2025 (from about 7,500 in 2024) and, on top of the 17,000 resale units, together pushed the year's volume to a high. This wave — a "new-launch flood" — is precisely the key premise for understanding absorption.
The Absorption Truth
The commonly quoted "absorption period" lumps new launches and resale together — and this systematically overstates the market's true liquidity.
The reason: new launches are released in bulk and generate large short-term volume, inflating the absorption denominator and making the period look short; but those transactions do not reflect the absorptive capacity of resale supply. Using URA's type-of-sale field to strip out new launches and count resale only, the gap is startling: market-wide absorption stretches from 20 months on the "all-sales" basis to 38 months on the "resale-only" basis — nearly double.
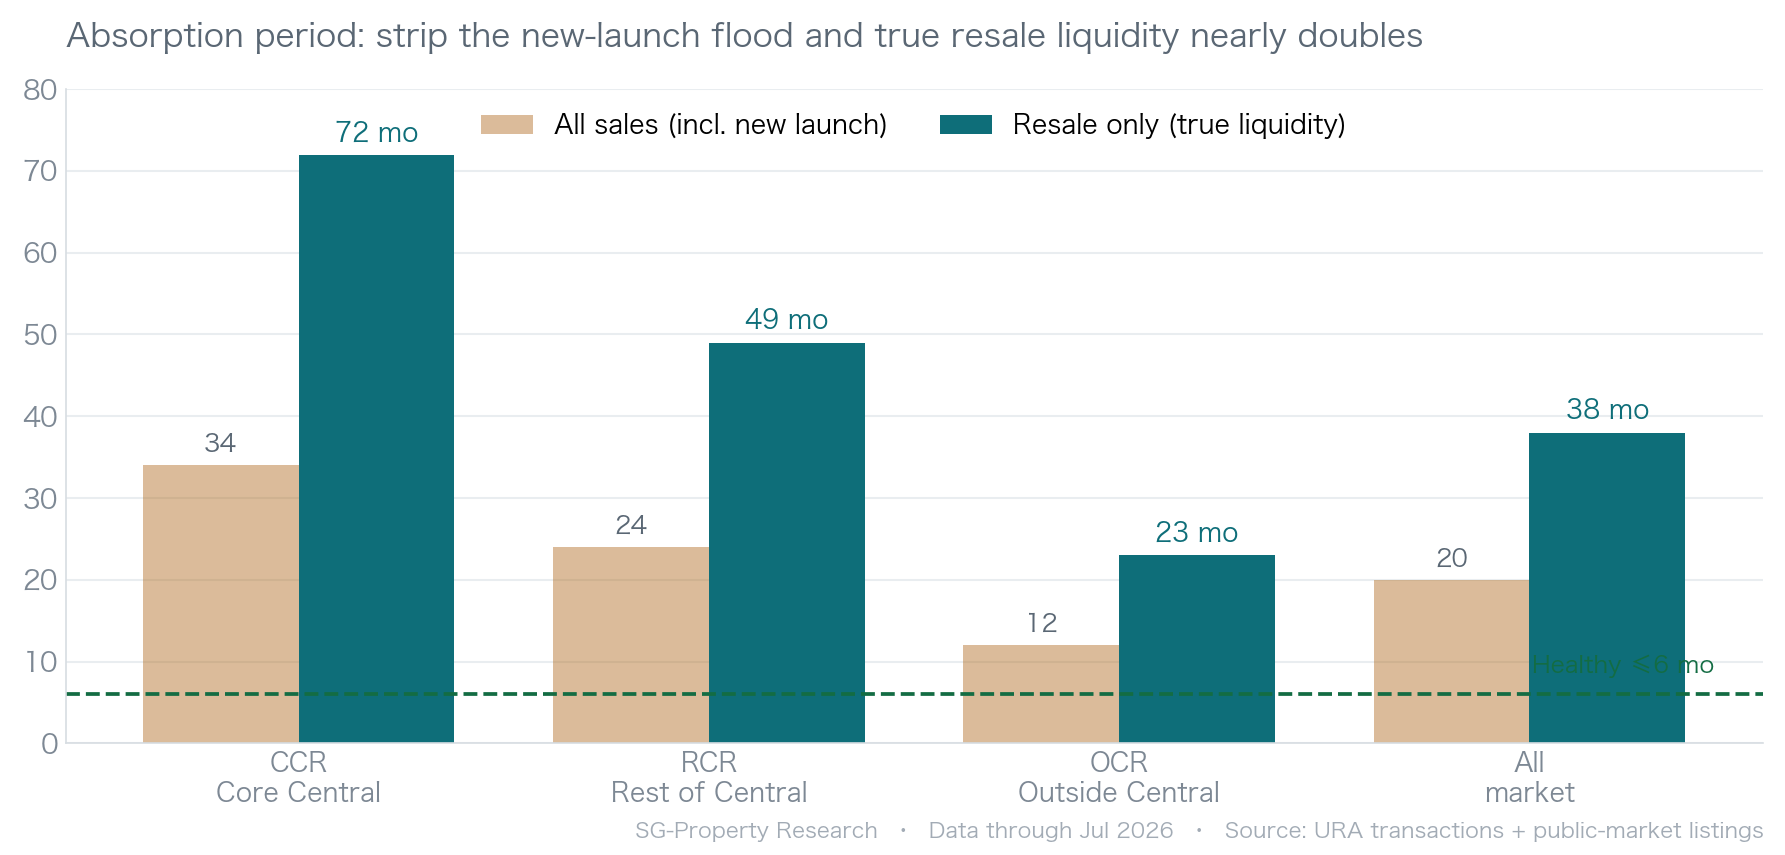
By segment, OCR (Outside Central Region) resale absorption of about 23 months is the most active, with the strongest owner-occupier demand relay; RCR is about 49 months; CCR (Core Central Region) resale runs about 72 months and is the hardest to clear, where high quantums and a narrow buyer pool carry the greatest liquidity risk. The next time you see an upbeat "sold out in a few months" claim, it is worth asking first: is that new launch, or resale?
| Segment | Listing inventory | 12-mo transactions | of which resale | Absorption (all sales) | Absorption (resale only) | Avg PSF |
|---|---|---|---|---|---|---|
| CCR Core Central | 13,785 | 4,801 | 2,292 | 34 mo | 72 mo | $2,486 |
| RCR Rest of Central | 15,149 | 7,585 | 3,722 | 24 mo | 49 mo | $2,115 |
| OCR Outside Central | 14,371 | 14,057 | 7,645 | 12 mo | 23 mo | $1,583 |
| All market | 43,305 | 26,443 | 13,659 | 20 mo | 38 mo | — |
Strip out the "new-launch flood" and market-wide true resale absorption nearly doubles. When measuring liquidity, always separate new sale from resale — the same basis every deep-dive report on this platform uses.
Segments & Categories
Price is about segment, choice is about category — one chart to grasp Singapore's private residential price ladder and mix.
The non-landed average PSF forms a clear ladder: CCR $2,486 › RCR $2,115 › OCR $1,583, with the core region roughly 1.6× the suburbs. By category, condominiums/apartments account for about 78% of transactions, ECs about 12%, and landed about 8% — condos are the outright mainstay, ECs the subsidy-gated "sandwich" option, and landed the scarce apex.
Deep-Dive Reports
Beneath this overview, we provide a dedicated deep-dive report for each category — on a consistent basis and cross-referenceable:
Notes & Sources
- Transaction data
- URA private-residential caveats (volume, transacted PSF, type of sale, tenure, market segment).
- Listing inventory
- Live public-market (is_alive) listings, assigned to CCR / RCR / OCR by postal district.
- Absorption period
- Current listing inventory ÷ trailing-12-month monthly average transactions; "resale only" removes new launches (type of sale = new sale). Healthy benchmark ≤6 months.
- Non-landed / landed
- Non-landed = condominiums/apartments + ECs; landed = terrace/semi-detached/detached. PSF is based on non-landed.
- Market segment
- Uses URA's official marketSegment (CCR / RCR / OCR).
- Time range
- URA transactions on a rolling basis; this report uses 2021 to July 2026.
Cite this report
PropertyWealth Research Team, "Singapore Private Residential Market Overview: Transactions, Prices, the Absorption Truth & Market Segments (2021–2026)," July 2026.
https://sg-property.ai/reports/singapore-private-property-market-overview/en/
Want to know which segment and category give you the most for your budget?
Tell PropertyWealth your budget, preferred areas and preferences, and we'll combine live listings with URA transactions to surface low-premium, high-value homes for you.
Start asking AI for free →